All Signs Point to Possible Price Ceiling Preventing Progress
Bitcoin meets resistance at $65,000 after rallying 22.31% ($11,722) in just eighteen days, an impressive feat for an asset that is still inside a bearish trend. With many different technical studies and historical price action as evidence in support of $65,000 being a strong level of resistance, a pullback should be expected and would be healthy for the asset should it continue higher.
Today’s gains of around $900 (1.5%) would make the first decisive candle since last Thursday if Bitcoin can manage to hold onto its price advance and close at current pricing. This would mark the first day in almost a week that contained a bias to either the upside or downside. The previous four daily candles all formed as a typical doji, with very small bodies and wicks stretching above and below the body. Also, the opening and closing prices all fell within a tight range of $627 (1.00%).
A trifecta of technical indicators converges in the area just below $65,000 creating a formidable area of technical resistance. The first is simply the 200-day simple moving average that has capped price action for 5 consecutive days. After having no influence on the price for 275 days, this average acted as effective resistance on 15 occasions since the 4th of July.
The other two studies both come from Fibonacci retracement levels. The first retracement begins at $50,581 and stretches to the all-time high of $73,794. The second retracement spans from the dramatic low of March 4th at $59,313 up to the all-time high. The two Fibonacci retracements contain quite a few harmonies at various levels. A total of four harmonics are formed between the two retracements. The harmonic that is forming current resistance is comprised of the 61.8% Fibonacci retracement of the longer data set ($64,845) and the 38.2% of the shorter one ($64,927).
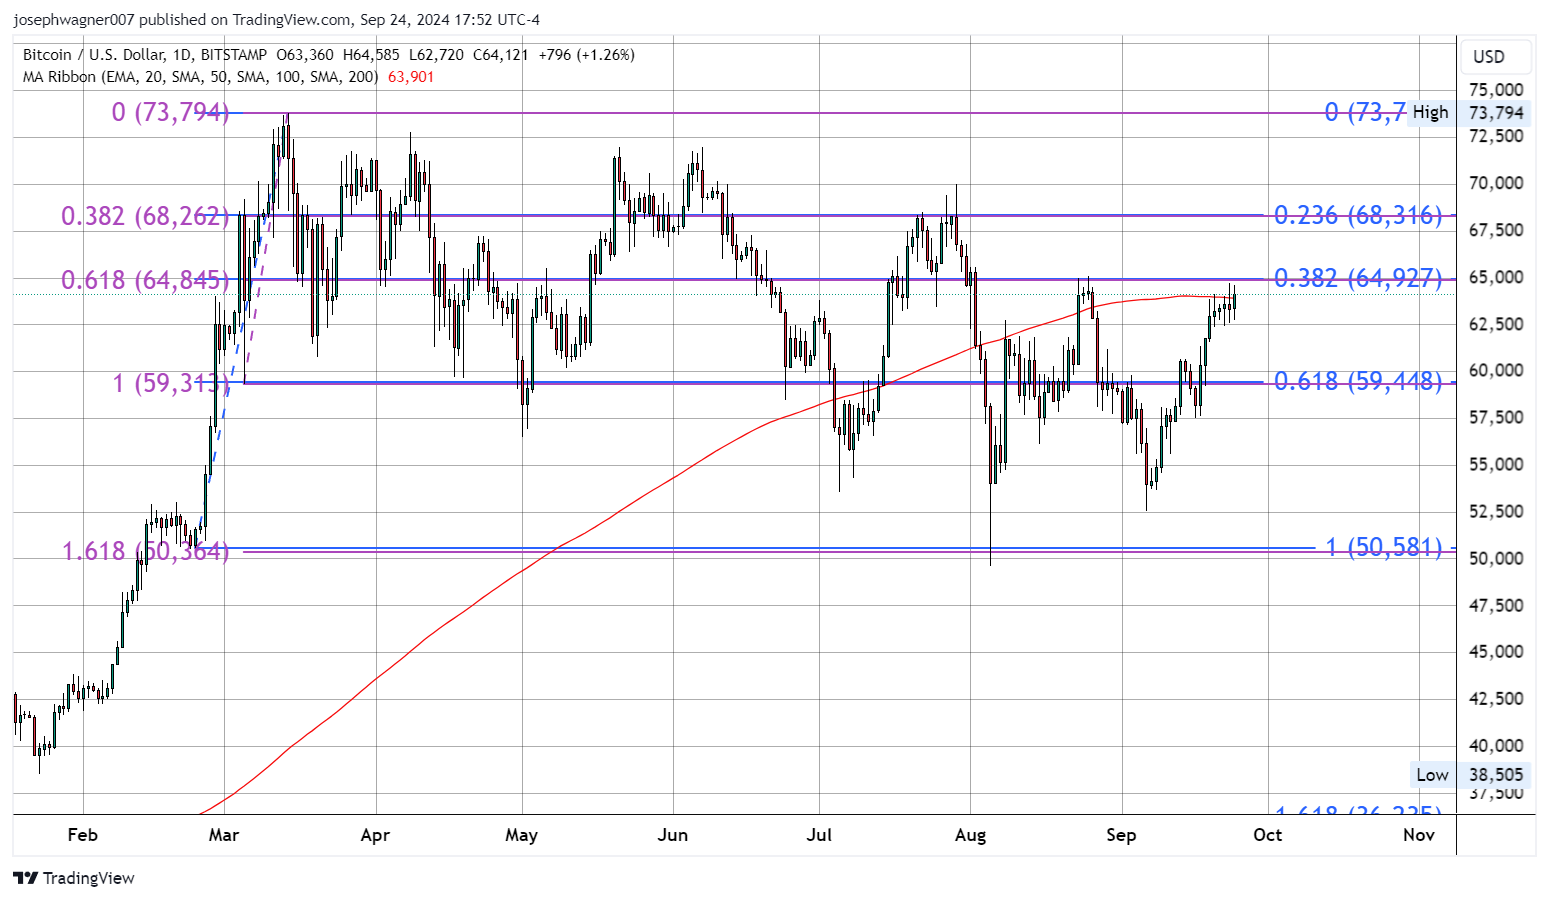
Recently this price point acted as a ceiling on August 23rd and 25th forming a double top with the recent failed attempt to breach above the same area of resistance.
Because the area just below $65,000 represents such a strong area of resistance we made the decision to pull profits on our long position in BTC initiated on Friday September 20th from $63,445 for a profit of $1,500 per Bitcoin.
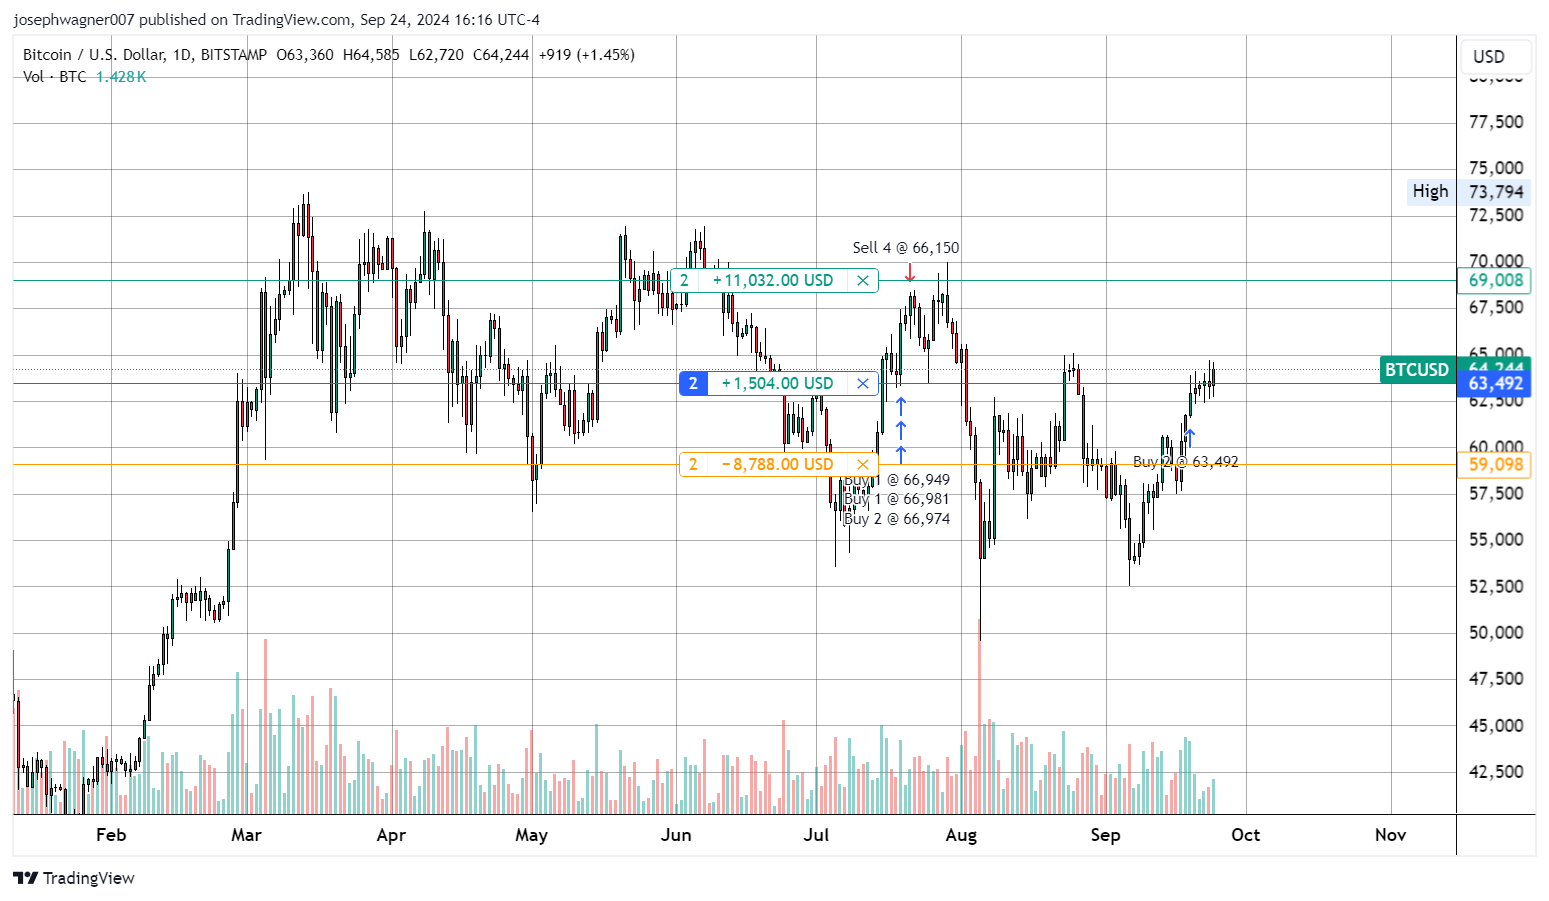
A pullback here we expect as the most probable outcome over the next day or two. If Bitcoin does happen to move beyond $65,000 without correcting first, we will likely issue a trade recommendation to go long BTC. Once this area is taken out as a price ceiling Bitcoin has a good chance of testing $69,000 - $70,000.