Bitcoin Dominance Surges: What It Means for Price Action
Despite Bitcoin's recent gains of 3.18% daily and nearly 10% weekly, the leading cryptocurrency remains confined within a descending channel. This week's rally, while impressive, has only brought BTC to the channel's midpoint, a pattern that has defined price action for the past six months.
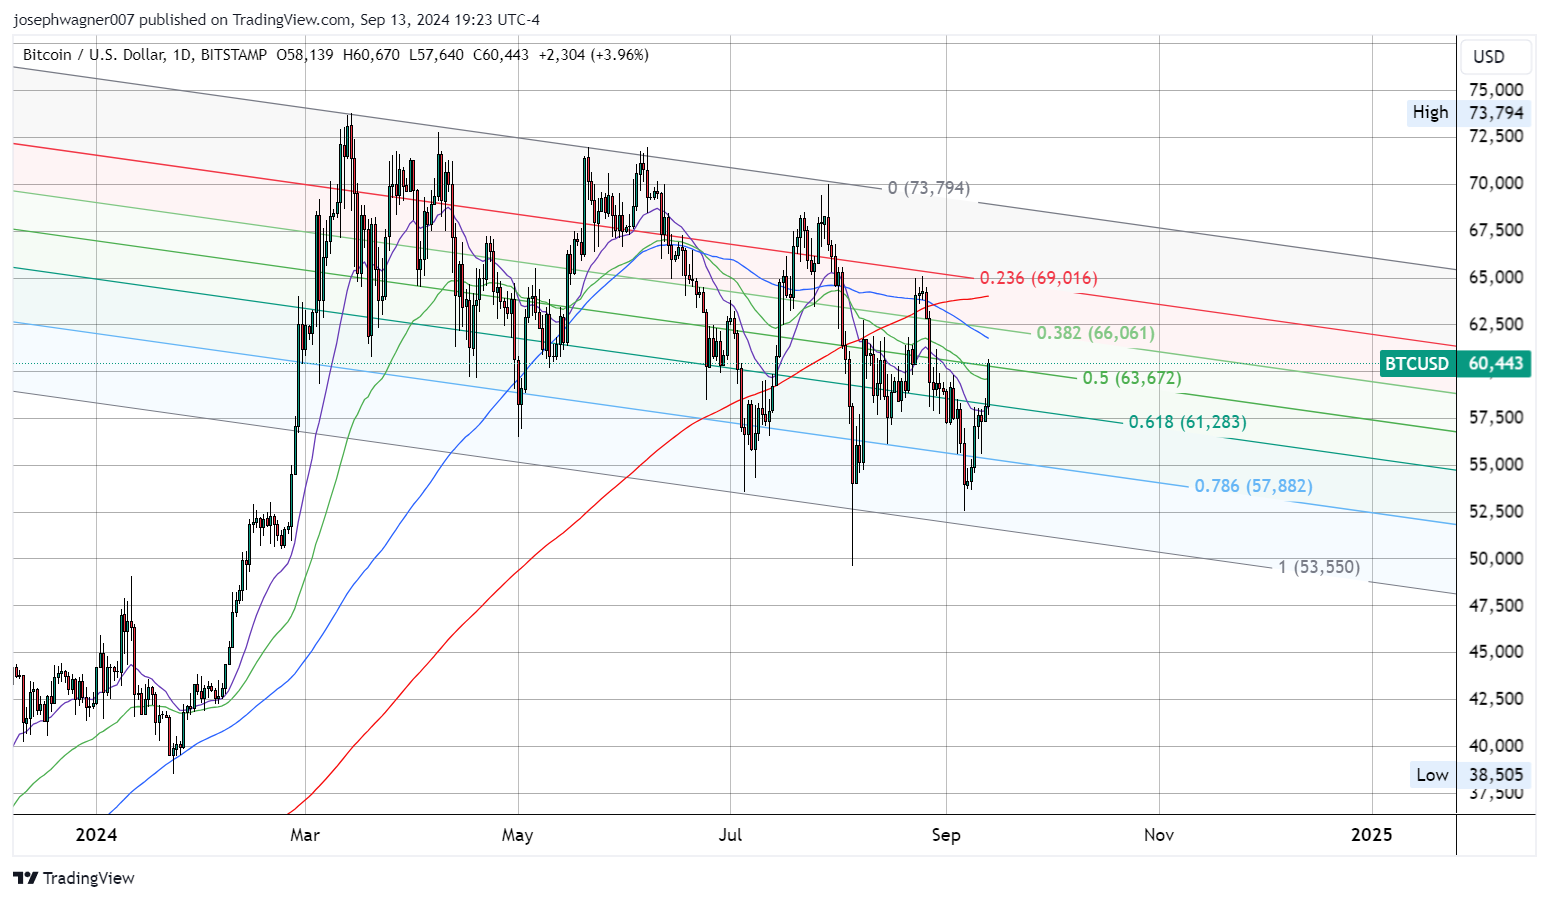
On the daily chart, Bitcoin touched the channel's 50% level at $63,672 before encountering resistance. A push to the 38.2% Fibonacci level above $66,000 appears feasible in the coming week. Short-term bullish signals are evident, with BTC opening at the 20-day exponential moving average (EMA) and closing above both this and the 50-day simple moving average (SMA). However, the mid to long-term trend remains bearish, as price sits below the 100 and 200-day SMAs, all three of which are in bearish alignment. Near-term support can be found at the 61.8% channel level of $61,283.
Dominatrix Inside The Matrix
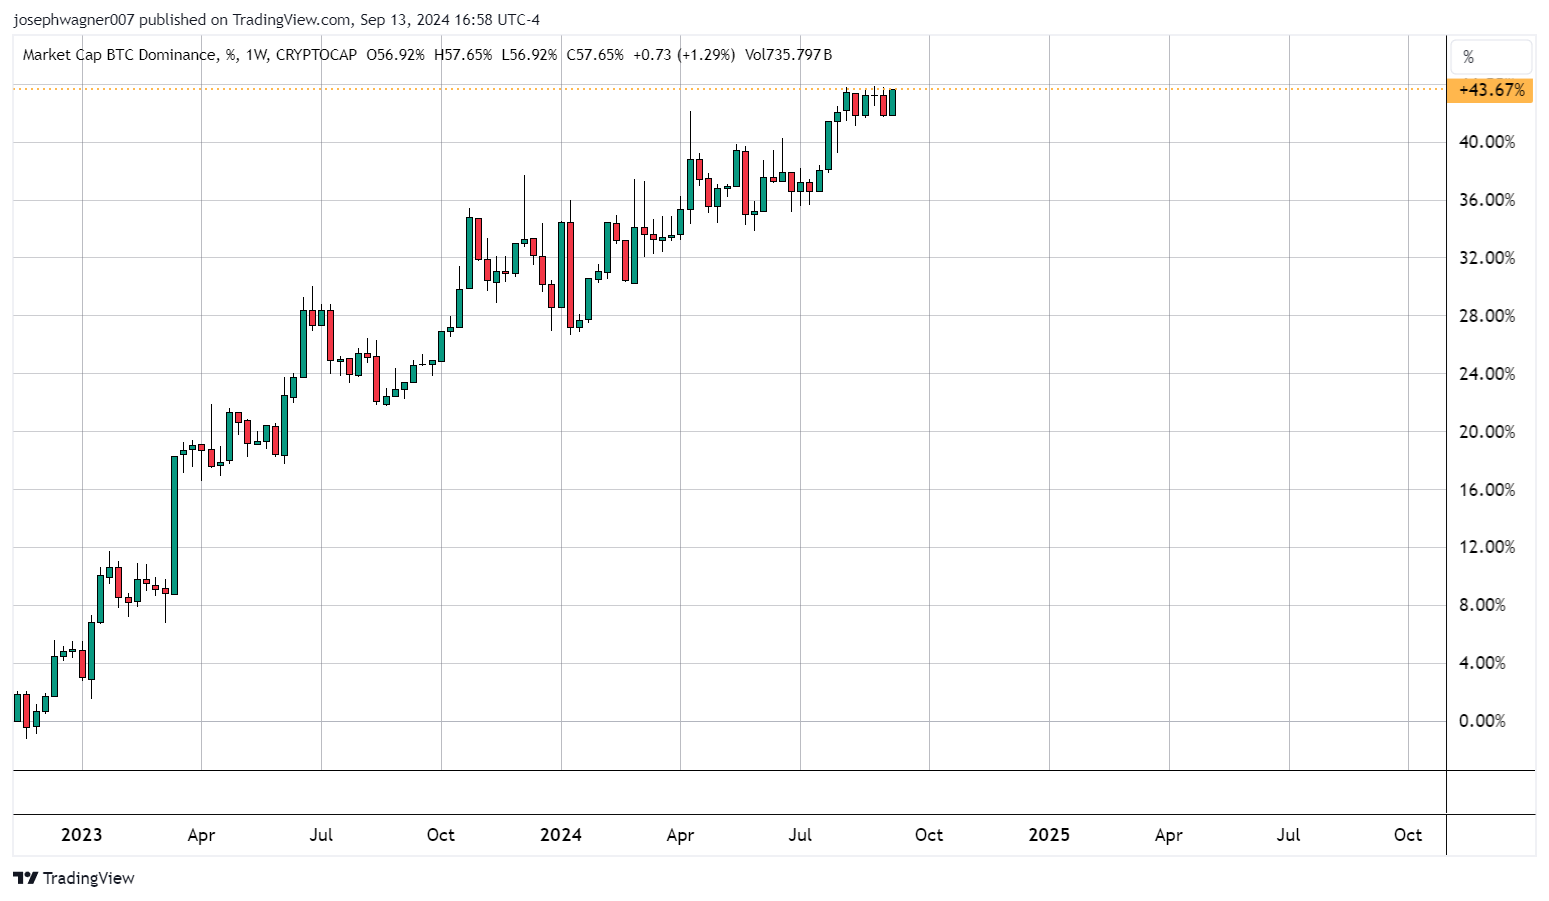
A key metric has surged to levels unseen since April 2021, offering crucial insight into Bitcoin's strength relative to the broader crypto market. Since November 2022, Bitcoin's market dominance has steadily risen, gaining an impressive 43.65%. This metric, once a crucial tool for predicting shifts from Bitcoin bull markets to altcoin seasons, now sits at a two-year high of 57.65% total market dominance.
Historically, Bitcoin's dominance has soared during true bull runs:
- Late 2017: As Bitcoin futures launched and BTC hit its historic $20,000 all-time high (ATH), dominance reached 71.51%.
- Summer 2019: Dominance again shot above 70% as price hit $12,000, rebounding from $3,000 bottom six months prior.
- 2021 Bull Run: Dominance peaked early, surpassing 70%, but had fallen to around 44% by the time Bitcoin made its final high of that cycle.
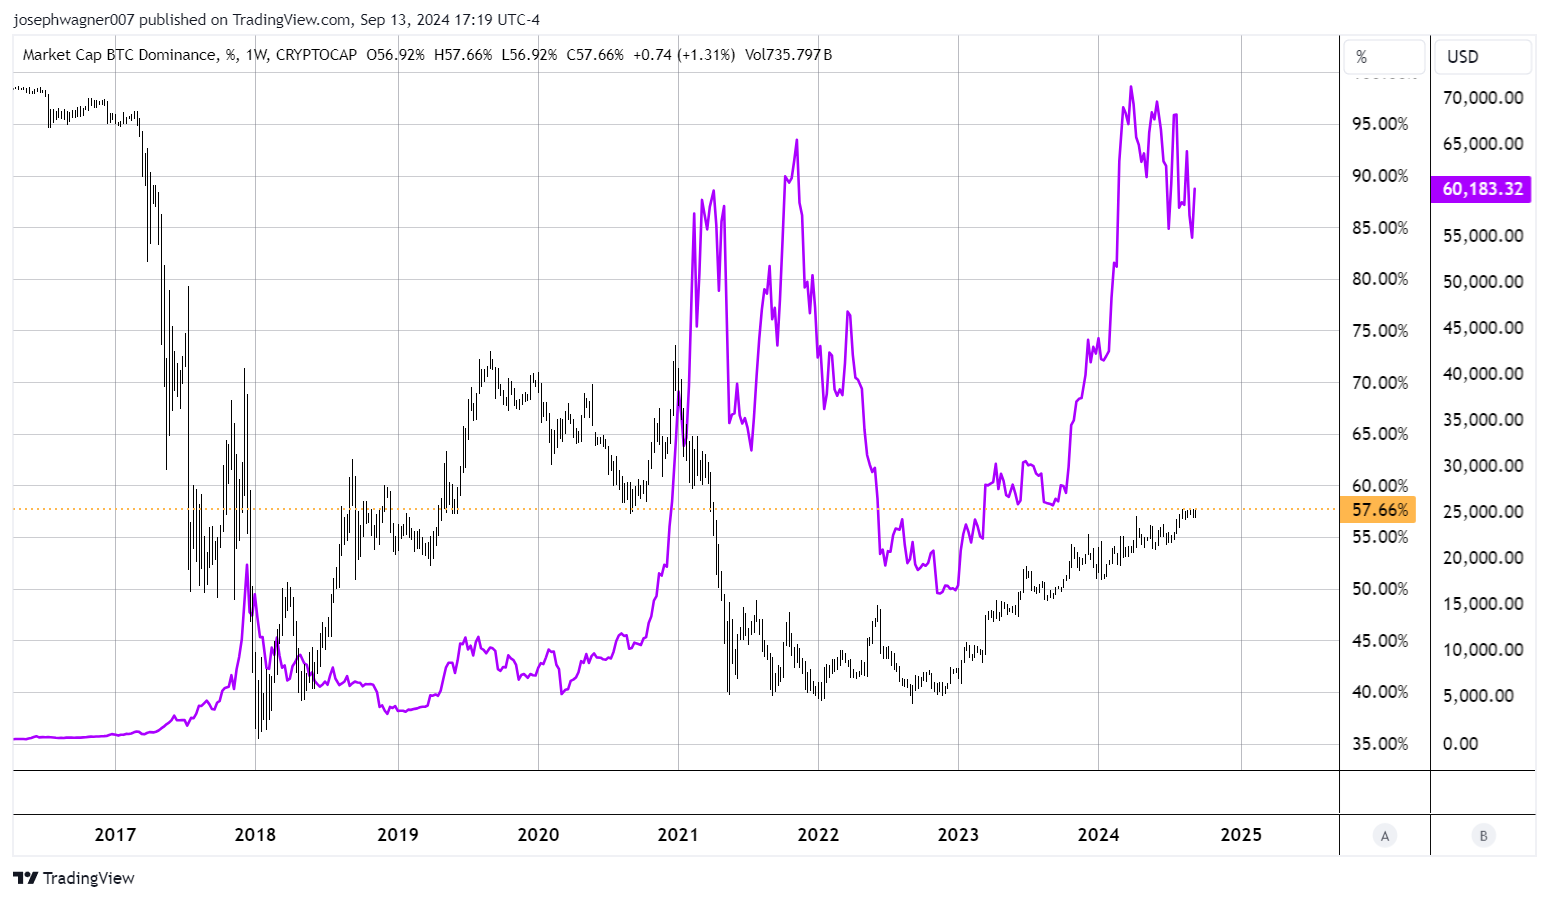
Interestingly, Bitcoin's current ATH of $73,000 occurred with 56% market dominance, facing strong resistance just below 58%. For six weeks, BTC has failed to breach this ceiling while price has steadily declined. This marks the first divergence between dominance and price since the November 2022 lows below $20,000.
Past cycle tops in 2018 and 2021 corresponded with market dominance peaks above 65%. A break above 60% market cap dominance could potentially signal an upcoming bull run in Bitcoin. However, recent price action presents a more nuanced picture. Over the last three months, Bitcoin has made three lower highs in price while making three identical highs in dominance. This pattern suggests that the next true bull run might not materialize until the first quarter of 2025.
The relationship between Bitcoin's price and its market dominance has evolved over time. In previous cycles, dominance often peaked alongside or slightly before price. The current divergence between these metrics presents an intriguing scenario for analysts and traders to consider.
In the short term, watch for Bitcoin's ability to break above the 58% dominance level and how this correlates with price action. A simultaneous increase in both metrics could signal strengthening bullish sentiment. Conversely, continued divergence may indicate a prolonged period of consolidation or potential weakness in the broader crypto market.