Eastern Charting Techniques That Predicted Bitcoin’s Crash
It has been weeks since I have written any articles or issued any trades in BTC. It was not because I lost interest or has not been monitoring the markets, but simply because no apparent trend in either direction was visible, leaving me with no insights to act on, or even report on with confidence. That all changed Yesterday.
The Technique
Will peering at a one-hour candlestick yesterday, a clear and apparent bearish trend struck out at me. This came in the form of a clear trend made up of a series of consecutive lower lows and lower highs that began with a distinctive candlestick called a “hang man” or “hanging man.” This candle appears after an uptrend and consists of a small body with a long upper wick, usually at least three times the size of the real body.
This needs to be followed by a confirming candle, which needs to be a red candle with a lower low and lower high than the “hang man.” On our chart we got this confirmation, but our Ichimoku cloud was not signaling a bearish trend. however a few hours later it did prompting us to issue a sell order in BTC. I will outline the aspects of the Ichimoku cloud that I used to gain confidence when a clear trend did emerge, so even if you are not signed up for our trading service you can act on your own next time this pattern emerges.
The Build Up
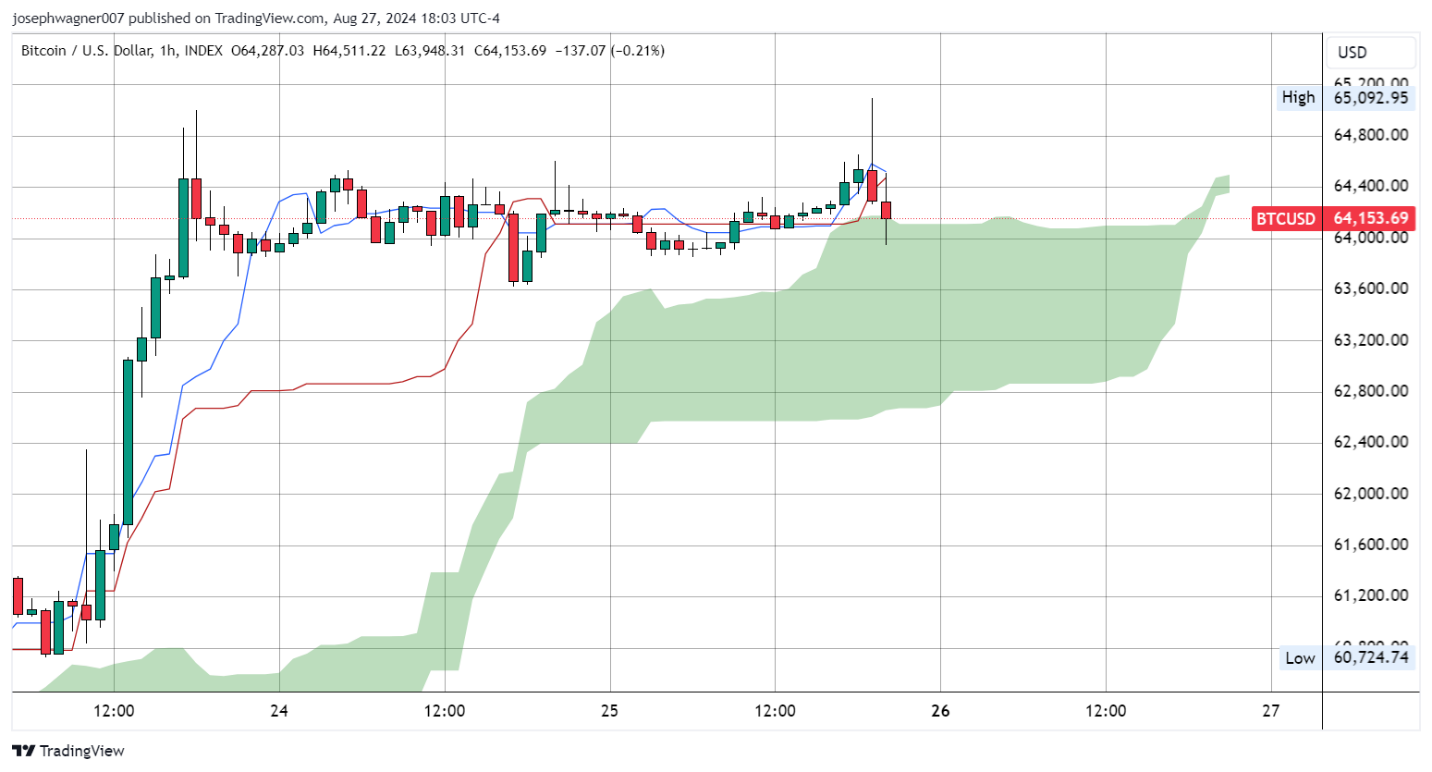
In the chart above, we see that on Sunday our “hang man” and our confirming candle both formed on our chart, but it was not in agreement with the Ichimoku cloud. Both the candle and its confirmation occurred above our cloud formation, which at the time was green. The fact that the cloud was filled in with a green shade would have given strength to a bullish trend, but gave us reason not to act on the bearish pattern at the time.
The cloud can often act as support or resistance, which in the chart above appears could have been the case. The conversion line (blue) and the baseline (red) can act as support or resistance as well, and in the chart above we see price action sandwiched between the base and conversion lines and the cloud formation. These attributes would flip and give us enough conviction to issue a trade recommendation yesterday at 5:16 PM (HST) or 11:16 PM Eastern Time.
The Signal
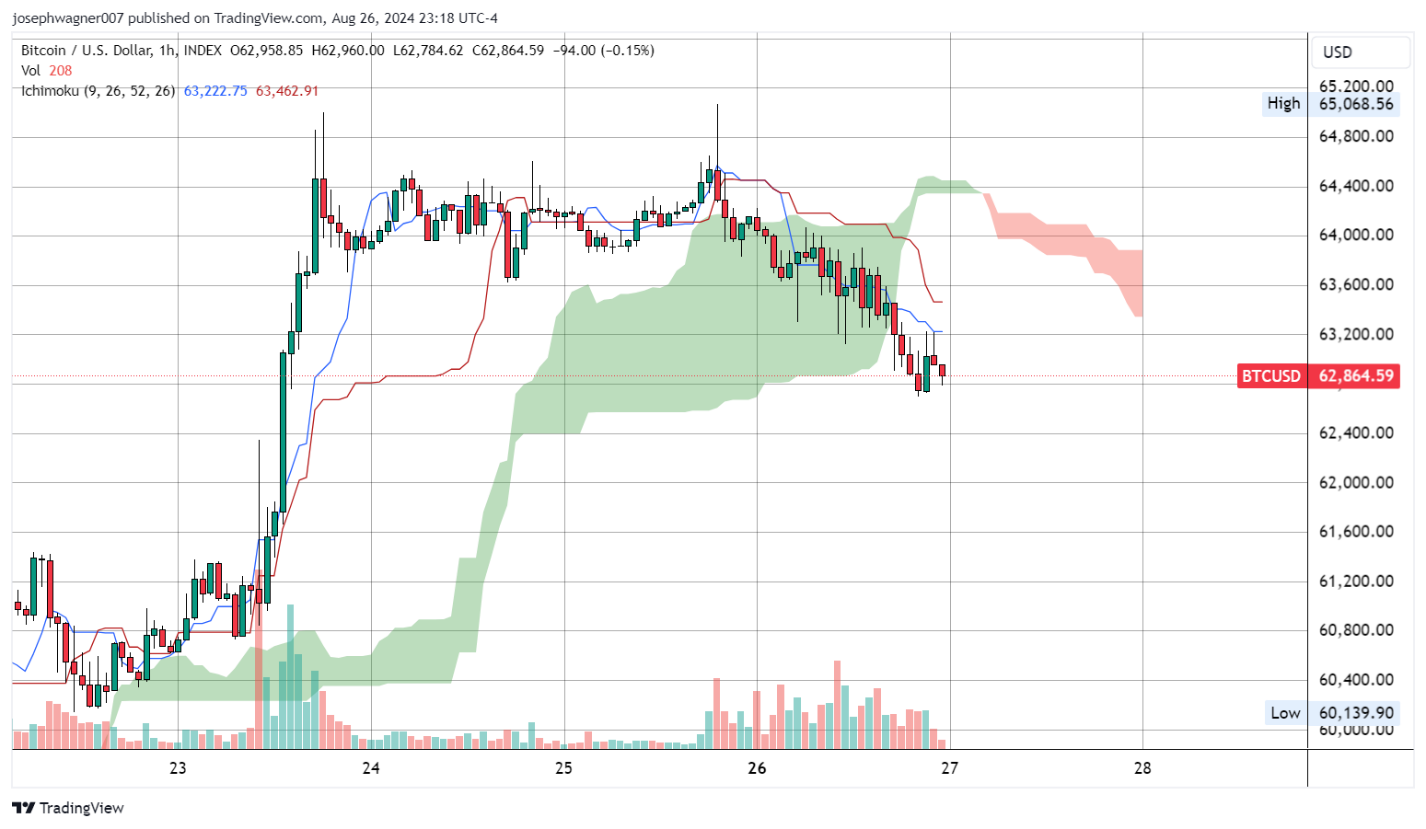
At around 11:16 Pm ET, we got another candle that loosely fit a “hang man” classification. This time it appeared beneath all the attributes of our Ichimoku cloud indicator described above. The cloud had also switched to a red hue. Both Eastern charting techniques (candlestick pattern, Ichimoku) were in confluence and called for lower pricing ahead.
Equally important was that this “hang man” candle had been rejected from the first level of resistance made up by the conversion line and was sent lower from there. Waiting for a test of an assumed level of resistance or support is a well-known technique used across many charting strategies.
Rejection from an assumed level of resistance (in a short trade) or support before entering an into a trade. The reasoning behind this is simple, it gives a trader real evidence of their assumption towards a move in either direction. This idea is universal and is utilized by traders using moving averages, Fibonacci retracements, historical price action, Bollinger bands, trend channels and many more technical studies.
The Result
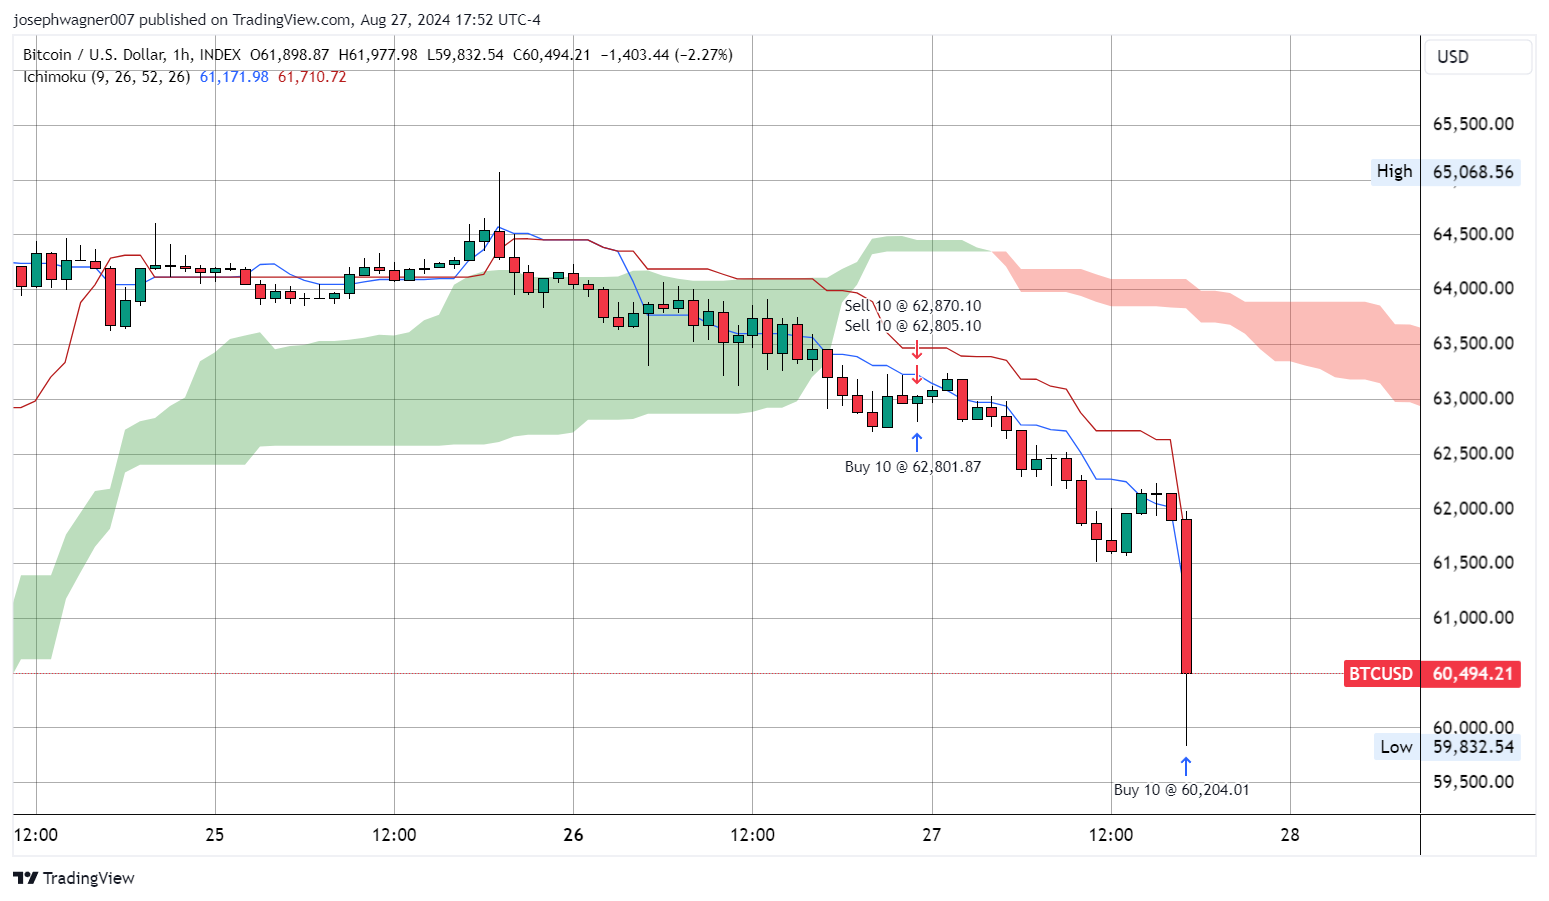
The clearly defined downward trend along with back testing of our hypothesis resulted in a very profitable trade that reached our target causing anyone taking my call to exit their short position at $60,200 earning a profit of $2,665 per Bitcoin (with no leverage) in less than a day.
The Lesson
While these methods are not always going to provide traders with guaranteed profits, using them in the way outlined in this article can greatly enhance the success rate of future trades you may enter.
It is my hope that the next time these two Eastern indicators are both in sync and calling for of a price move, you will be able to act accordingly. While this will likely require some practice and patience, understand that these techniques can be effective in any time-frame and in any market and therefore are worthwhile for any trader to become proficeint in recognizing.
Proper Action:
Traders that took our call yesterday entered into a short BTC position at $62,800
exited the trade today at $60,200, for a profit of $2,600 per Bitcoin.
Trader's should now have no open positions as we await signs of a further decline or a pivot in Bitcoin.