Rare Bullish Continuation Pattern Came Close to Completing
In recent days, Bitcoin has experienced a notable surge, driven by growing optimism surrounding potential interest rate cuts. According to the CME's FedWatch tool, the odds of a substantial 50-basis point reduction in the Federal funds rate have surpassed those of a more conservative 25-basis point cut over the past two days. While the market had already factored in a 25-point cut, the larger reduction was not priced into Bitcoin until today, when it was partially incorporated. This development suggests that while further price increases may occur if the Federal Reserve implements a half-percent cut tomorrow, Bitcoin could face a decline if the more significant 50-point reduction does not materialize.
Since reaching a low of $52,500 on Friday, September 6th, Bitcoin has rallied impressively, gaining nearly $8,000 - a surge of almost 15% in just 11 days.
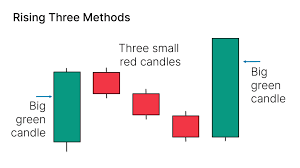
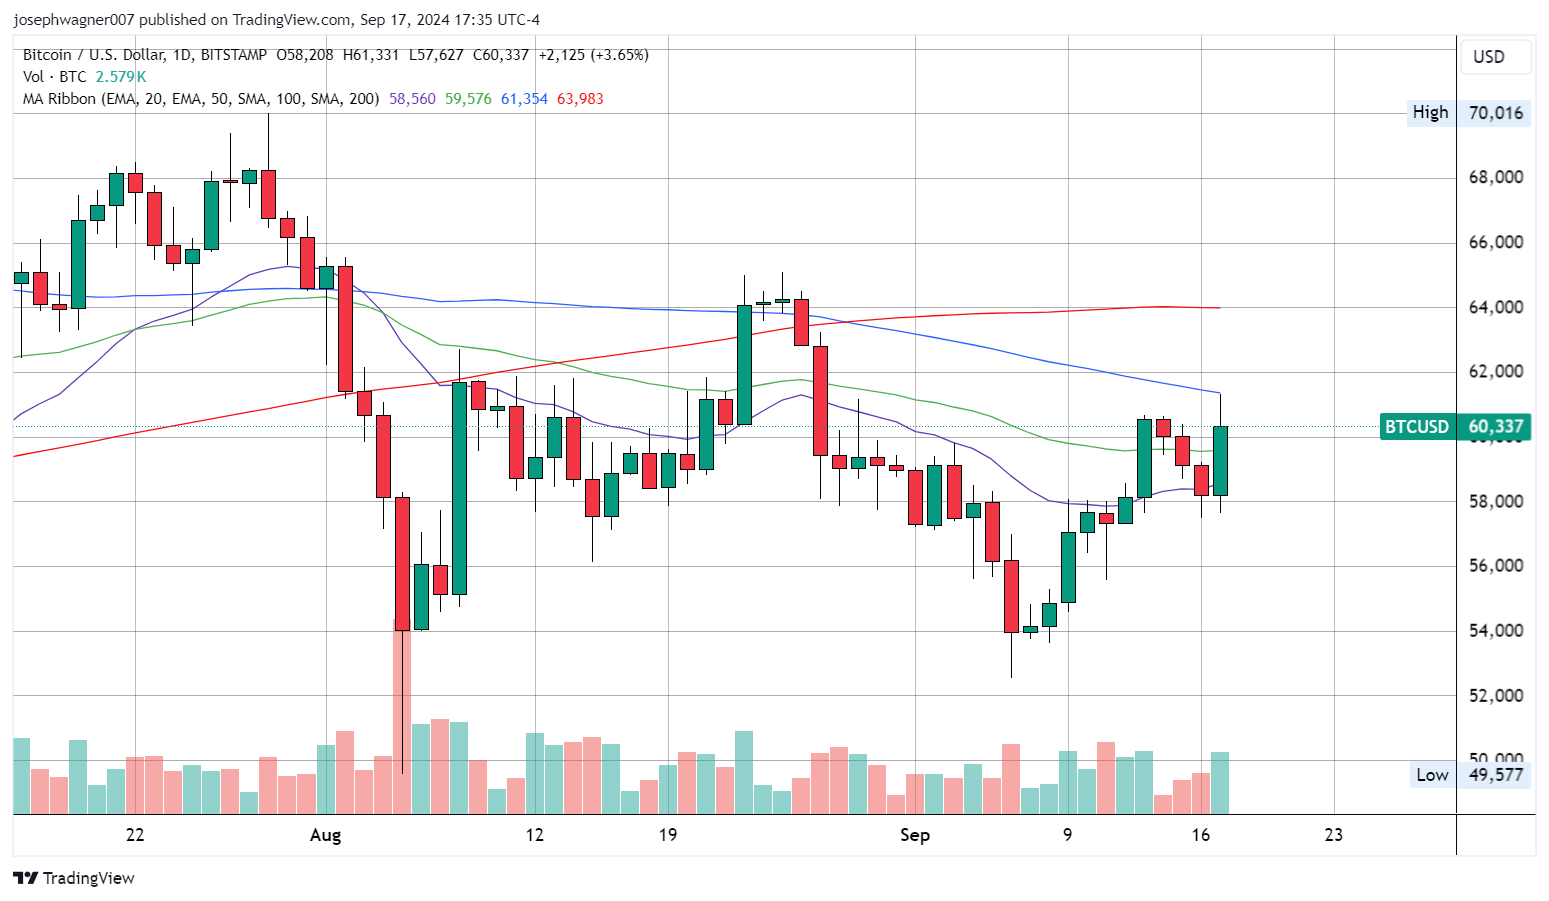
Today, Bitcoin came close to forming a bullish candlestick pattern known as a "rising three" on the daily timeframe. This uncommon 5-day pattern would have been textbook had Bitcoin not retraced significantly from its intraday highs. For the pattern to be valid, Bitcoin would need to close at or above $60,500 today. As of 5:34 EDT, Bitcoin was trading at $60,337, less than $200 away from completing the pattern.
The rising three methods pattern is a bullish continuation signal in candlestick charts, typically consisting of five or more candles. It begins with a long bullish candle, followed by two or more small bearish candles that remain within the first candle's range, representing a brief pause in the uptrend. The pattern concludes with a final bullish candle that opens above the previous candle's close and closes higher than the first candle, confirming the uptrend's resumption.
Several indicators align with the potential validity of this pattern, while others do not. Supporting the bullish continuation thesis is the volume profile, with the first and last candles (large green candles) showing significantly higher trading volume than the three small red candles in between. The price action relative to the 50-day Simple Moving Average (SMA) also lends credence to the pattern. With Bitcoin breaking above this average on the first candle, dipping below it on the third and fourth candles, and finally breaking back above the 50-day SMA on the last candle suggest this pattern is likely to be accurate in its prediction.
However, the alignment of other major moving averages (100-day and 200-day SMAs) is not optimal for this pattern. Ideally, the 200-day SMA would be positioned below the shorter 50-day SMA. Additionally, the 100-day SMA, currently above the 50-day SMA, acted as effective resistance today, coinciding with the intraday high that forced Bitcoin lower and ultimately invalidated this rare candle pattern.
While the anticipated rate cut could potentially boost prices further, Bitcoin has shown less reactivity to Federal Reserve optimism compared to other markets such as stocks and precious metals. A disappointing 0.25% cut would likely have a more pronounced effect than a well-received 0.50% reduction. So, until proved otherwise it seems that while bulls have moved the market for the last 11 days, bearish forces still maintain control overall.