Bitcoin and Ethereum test resistance

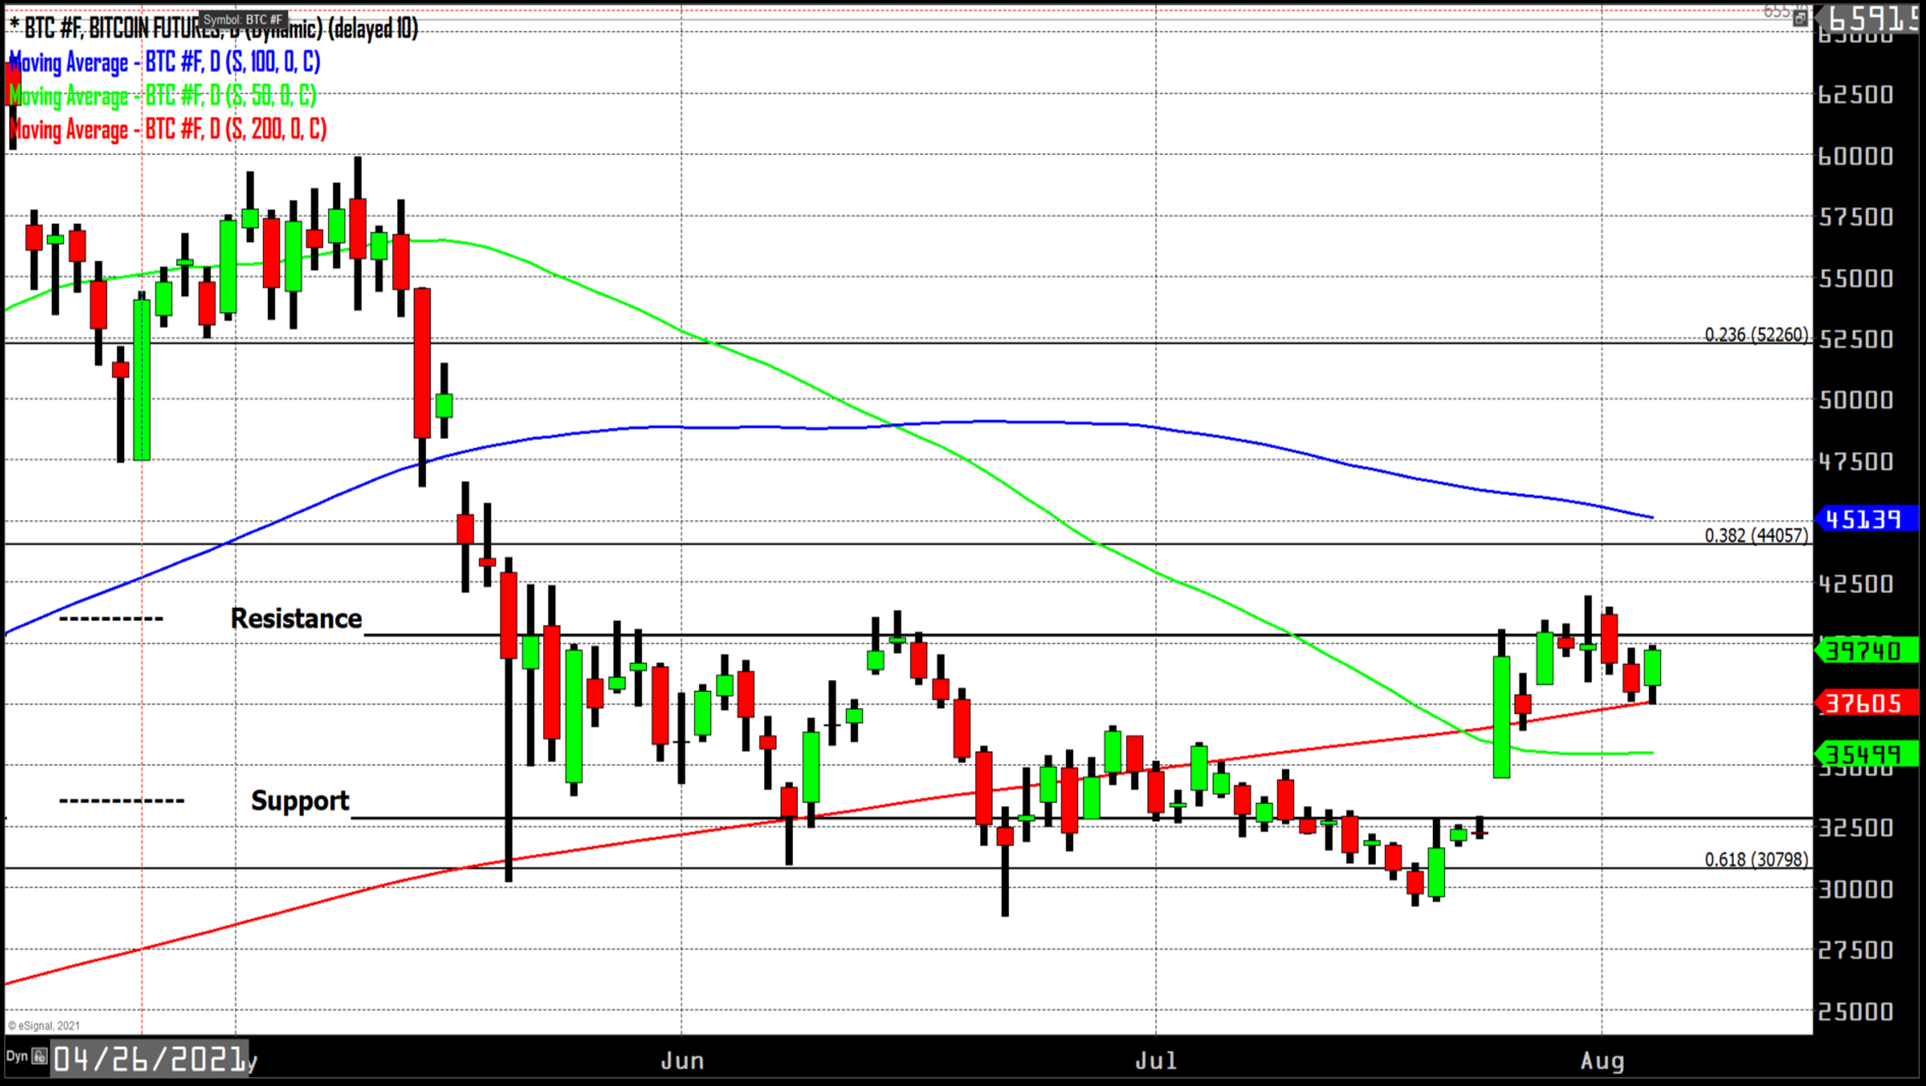
As of 5:30 PM, EST BTC futures are trading up 4.68% ($1,775) on the day and trading at $39,740. This puts pricing right up against resistance at $40,000, an area that BTC has yet to solidly close above since falling below it on May 19th. There is also resistance at $42,000 and at $44,000, but a break above $40,000 would be significant and likely signal the start of another rally in Bitcoin. BTC also retested support today at the 200-day moving average at $37,605, which matches up near the lows today at $37,465. This narrow band between support and resistance calls for little movement in the asset or that a break to either side is soon to occur.

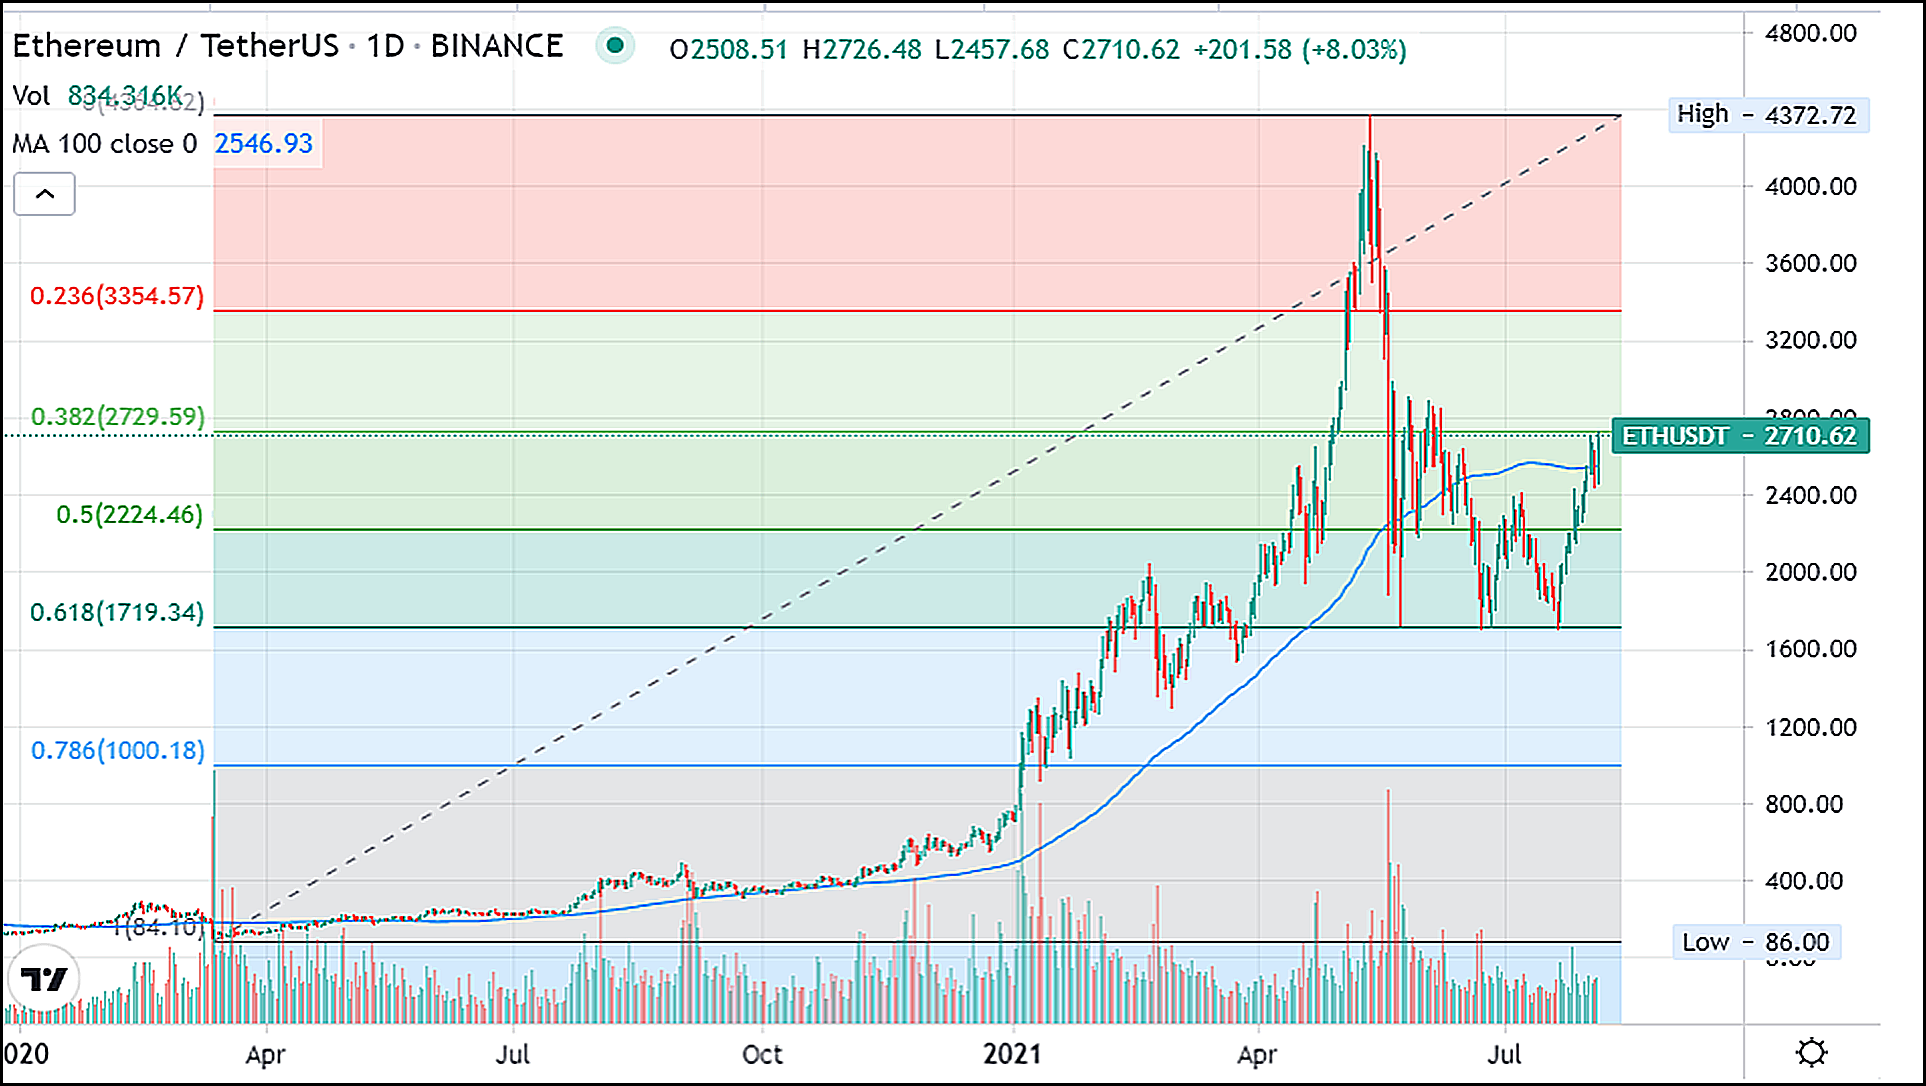
Ethereum is also trading up on the day by 8.95% ($222.43), currently at $2,706. This puts Ethereum right up against resistance like BTC, and the difference is unlike Bitcoin after this level there is not any technical resistance until after $3,000. The trend we witnessed this summer where Ethereum rose much greater on a percentage basis when compared to Bitcoin has re-emerged and is likely to continue. Over the last seven days Bitcoin has been flat, losing less than a quarter of a percent (0.24%). In the same time period Ethereum has gained over 18%.

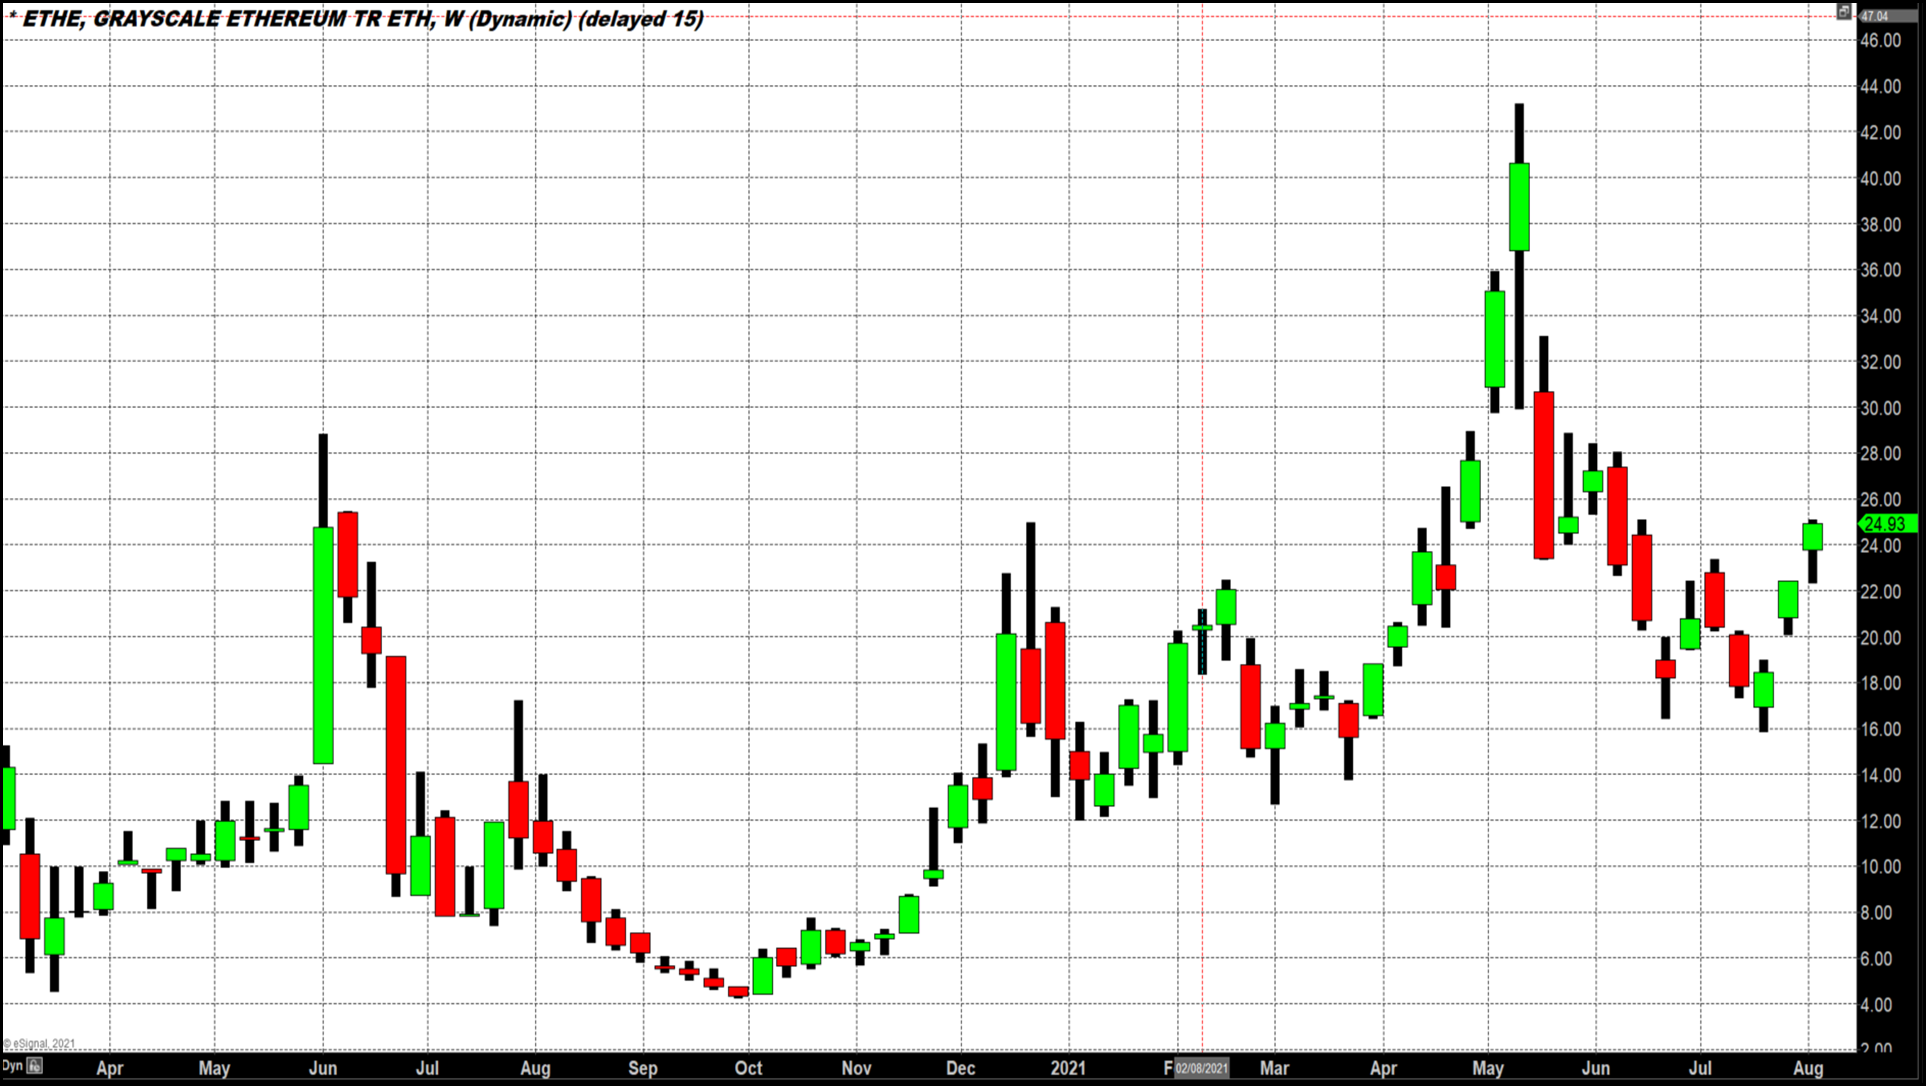
Ethereum having closed above its last major moving average (the 100-day) today has only its long-term 38% Fibonacci retracement level at $2,729 before having a clear shot to $3,350. Looking at the Greyscale Ethereum Trust (ETHE) on a weekly candlestick chart you can notice that we have had gaps to the upside over the last two weeks and closed at or near the highs for the last three weeks. This suggests that the rally is probably not going to stall at current resistance, and a break above would signal the rally is far from over in Ethereum, while Bitcoin is likely to stall at or near current prices.
