~ Bitcoin’s short and mid-term forecast ~
In last Wednesday’s article (Oct.20th), we went over our wave count for Bitcoin on a weekly candlestick chart, and today we have confirmation that the third wave that took BTC to its new record high has concluded. We will shed some light on where this fourth (corrective) wave could take us.
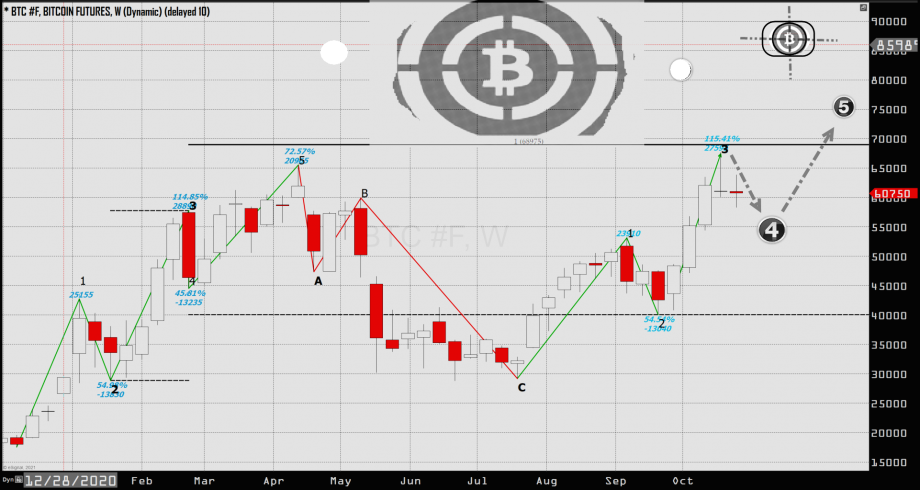
On our chart, the blue numbers shown at the conclusion of every wave represent the price advance or decline in dollar value and on a percentage basis of each wave compared to its preceding wave. Notice how similar the price moves for each wave have been to the corresponding wave achieved in the previous cycle. Wave one in both cycles is roughly $25k. The second wave of each cycle drawn both decline by 54%, which represents approximately a $13,000 price decline. The uncanny similarities demonstrated in the third waves are evident when compared, the last cycle and our current one both have third waves that took BTC $28,000 higher and in relationship their first waves they both extend 115% from the conclusion of their second waves.
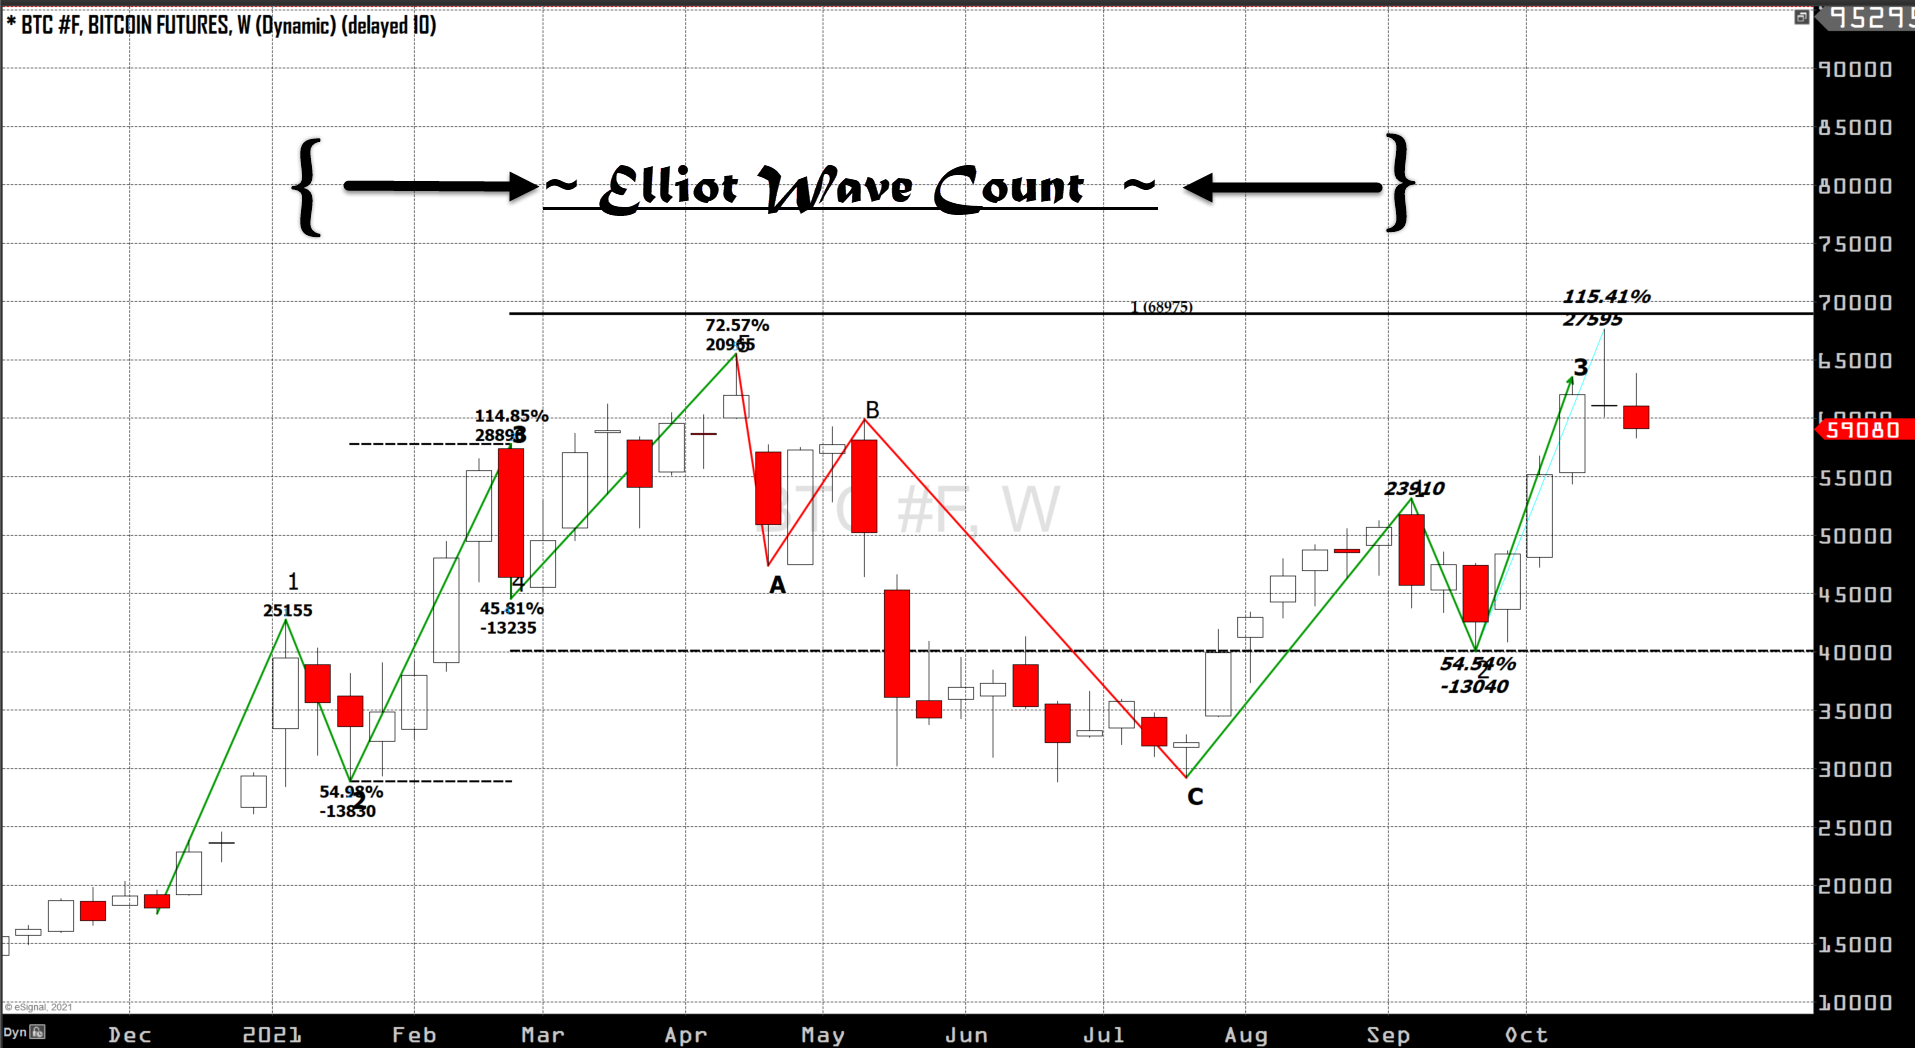
This same synchronicity between cycles is also demonstrated through a Fibonacci extension that compares wave three from the 2020/2021 rally to the third wave in our current count. The study reconfirms the synchrony between both moves showing this last impulse wave (wave 3) that took us to a new ATH. The rally that brought us over 67k corresponds to a one-to-one relationship to the third wave in the previous count.
If this remarkable symmetry continues it would suggest that just as all of the corrective waves in both impulse phases have done so far this year (excluding A, B, C corrective period following most all impulse cycles “wave 1-5”), we will see a $13,000 decline from the conclusion of the impulse wave three. This would bring us to around $54,000 which is where we are forecasting for the current correction to conclude.
As long as BTC follows this model and does not break below $54k then there is every reason to believe that BTC, following this wave four correction, will rally to a new ATH of around $75,000 as forecasted through multiple technical theories and tools.
To summarize our projections, bearish in the short-term (1-2 weeks) going as low as $54k, but bullish in the mid-term (1-2 months) reaching as high as $75k.