Clear cut symmetry spells further selling in BTC

Bitcoin futures are trading lower by $2600 or (7.44%) at $32,365 as of 4 PM EDT. This puts the price back below the 200-day moving average. Today’s candle is almost identical to Monday’s candle with basically the same high and low, and bodies of the candle end at the same area, right around $32,750. $36,000 has become an area of minor resistance as pricing wasn’t able to move above this level for the entire week; with three of the five days this week, pricing traded to just below this level.
The critical support level at approximately $30,700 was broken through on an intraday basis Tuesday of this week. This alludes to the possibility that we will get a break below this level in the coming weeks. If and when that occurs, I expect a violent fall down to $23,000 to backfill the gap that remains on the CME futures 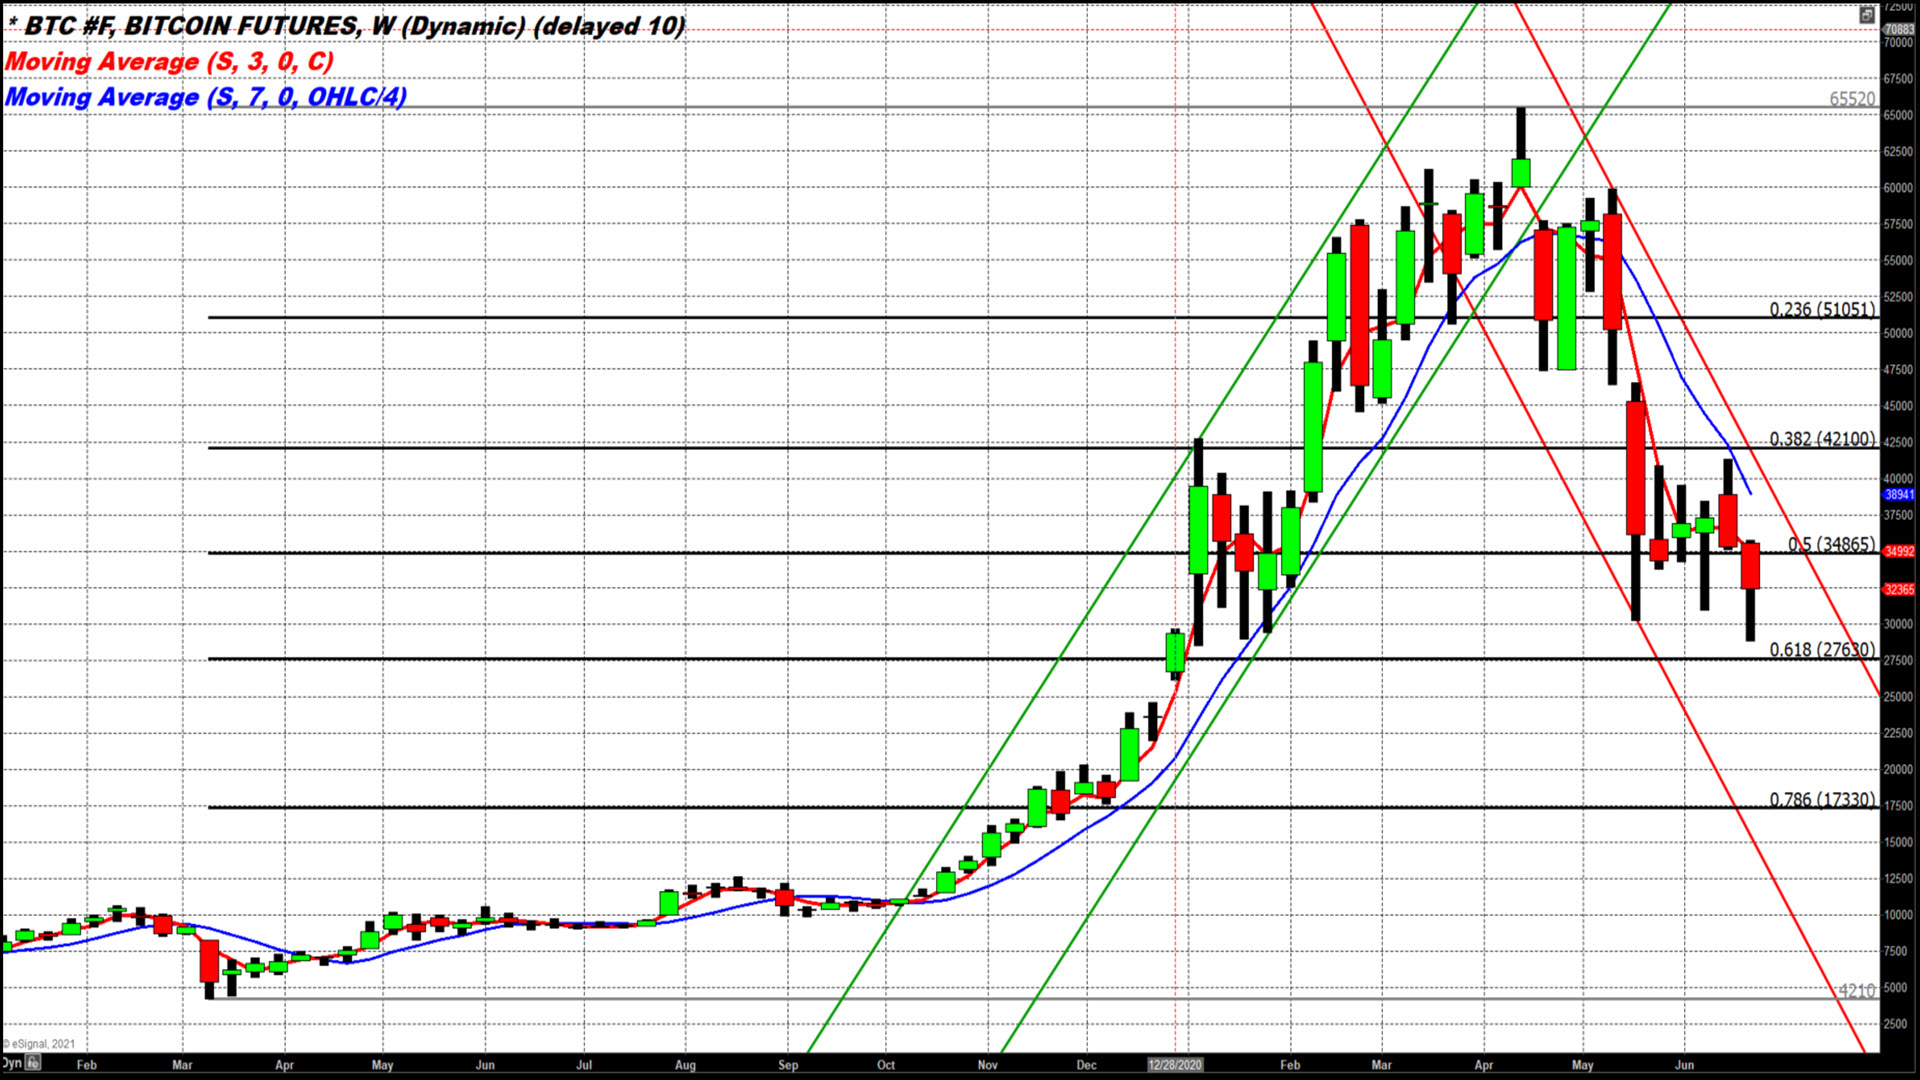 chart between December 24 and December 28 stretching from $23,000-$26,000.
On our weekly candlestick chart, notice that we have included a new Fibonacci data set starting from the lows of March 2020 to the all-time high hit in April 2021. You will see some astonishing symmetry between the candles between the run-up that lasted until May and the subsequent correction we are still immersed. Notice the correlation between the two moving averages the 15-day and 21-day (three week and seven week). On the way up, the 15-day severed as support during the steepest parts of the climb, and the 21-day was absolute support.
The final apex hit at approximately $65,000 marked the end of the bullish channel. The following week notice how prices fully exited the bull channel the two moving averages also switched to a bearish alignment with the shorter 15-day on the bottom. This last week was the nail in the coffin according to my technical data. Not only were we unable to open and trade above the 15-day signaling the decline has hastened but the space between the moving averages is growing. This shows that the correction has gained momentum.
This week’s candle also closed well below the 50% retracement. Notice that on the way up pricing broke above and below this level three times (same as on the way down) after running up $12,000 the previous week creating the gap yet to be backfilled. In those last two weeks of December notice, it was one of the few times the 3-week moving average was truly support. Juxtapose that with current action where that same moving average has just become resistance. If the remarkable symmetry that has been prevalent from the rally beginning in October to the correction that began in April, then we are in for a swift fall to backfill the $23,000-$26,000 gap next week.