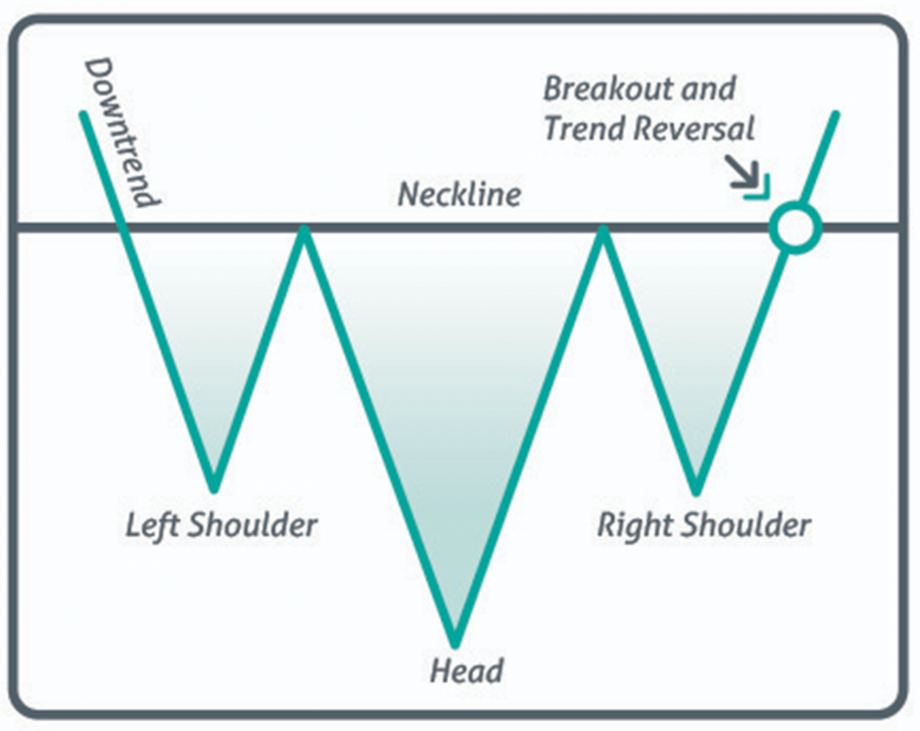
Inverse head and shoulders pattern in BTC

While today BTC futures as of 4 PM EST, are trading fractionally lower to the tune of $75 (0.55%) in the CME and on the NYSE so far Bakkt November futures are showing a decline of $115 or 0.84% for the day. Although a test of the $12,600 level is likely one simply has to look at a daily candlestick chart to reveal that the low today made 12 consecutive higher lows for BTC. So, test or no test of the current support level we are most likely going to see higher pricing in the short term if BTC can continue to close above the all-time 61.8% Fibonacci retracement level residing at $13,581.
We are essentially at the breakout point for an inverse head and shoulders pattern where the neckline is made up of 2019’s highs (around $14,000) and current pricing. What this means for Bitcoin futures is that on a technical basis if we effectively take out last year's highs and complete the inverse head and shoulders pattern. In turn, we could see Bitcoin futures fly to as high as $16,000 after breaking above the neckline at approximately $14,200. One caveat to this is the RSI is indicating we could be in overbought territory.
With the election one day away it seems a win by either candidate could push BTC past this threshold but we will wait and see if an initial knee jerk reaction occurs immediately following the results and look to enter from the long side possibly after the dust settles.