Bitcoin bulls attempt to re-claim $20,000

In trading last night overseas, Bitcoin broke out above its descending triangle for the first time since June. BTC traded over its resistance trendline at around 11 PM ET, the same hour hitting the high for the week at $19,954. BTC held above the upper resistance trend line for almost 6 hours before moving back into the descending triangle. Bulls were able to move above the resistance trendline once more making a slightly lower high of $19,800. However, at the start of the New York Markets, the bears regained control taking us back into the descending triangle.

One interesting confluence of indicators is that the 50-day simple moving average aligns with the current placement of the upper trendline. BTC has only moved above the 50-day SMA once in the past month.
What do technicians look for in a descending triangle?
Since we have been labeling a descending triangle in Bitcoin, I feel it is prudent to discuss what exactly that is but more importantly how do technicians look to trade these patterns?
The descending triangle is a bearish formation that appears as a continuation pattern during a decline. Descending triangles can emerge as reversal patterns at the conclusion of an upswing, although they are usually continuation patterns. Descent triangles, regardless of where they appear, are bearish patterns that suggest distribution. The length of the pattern can range from a few weeks to many months, with the average pattern lasting from 1 to 3 months. Once a breakout has occurred, the price projection is projected by measuring the widest distance of the pattern and subtracting it from the resistance breakout.
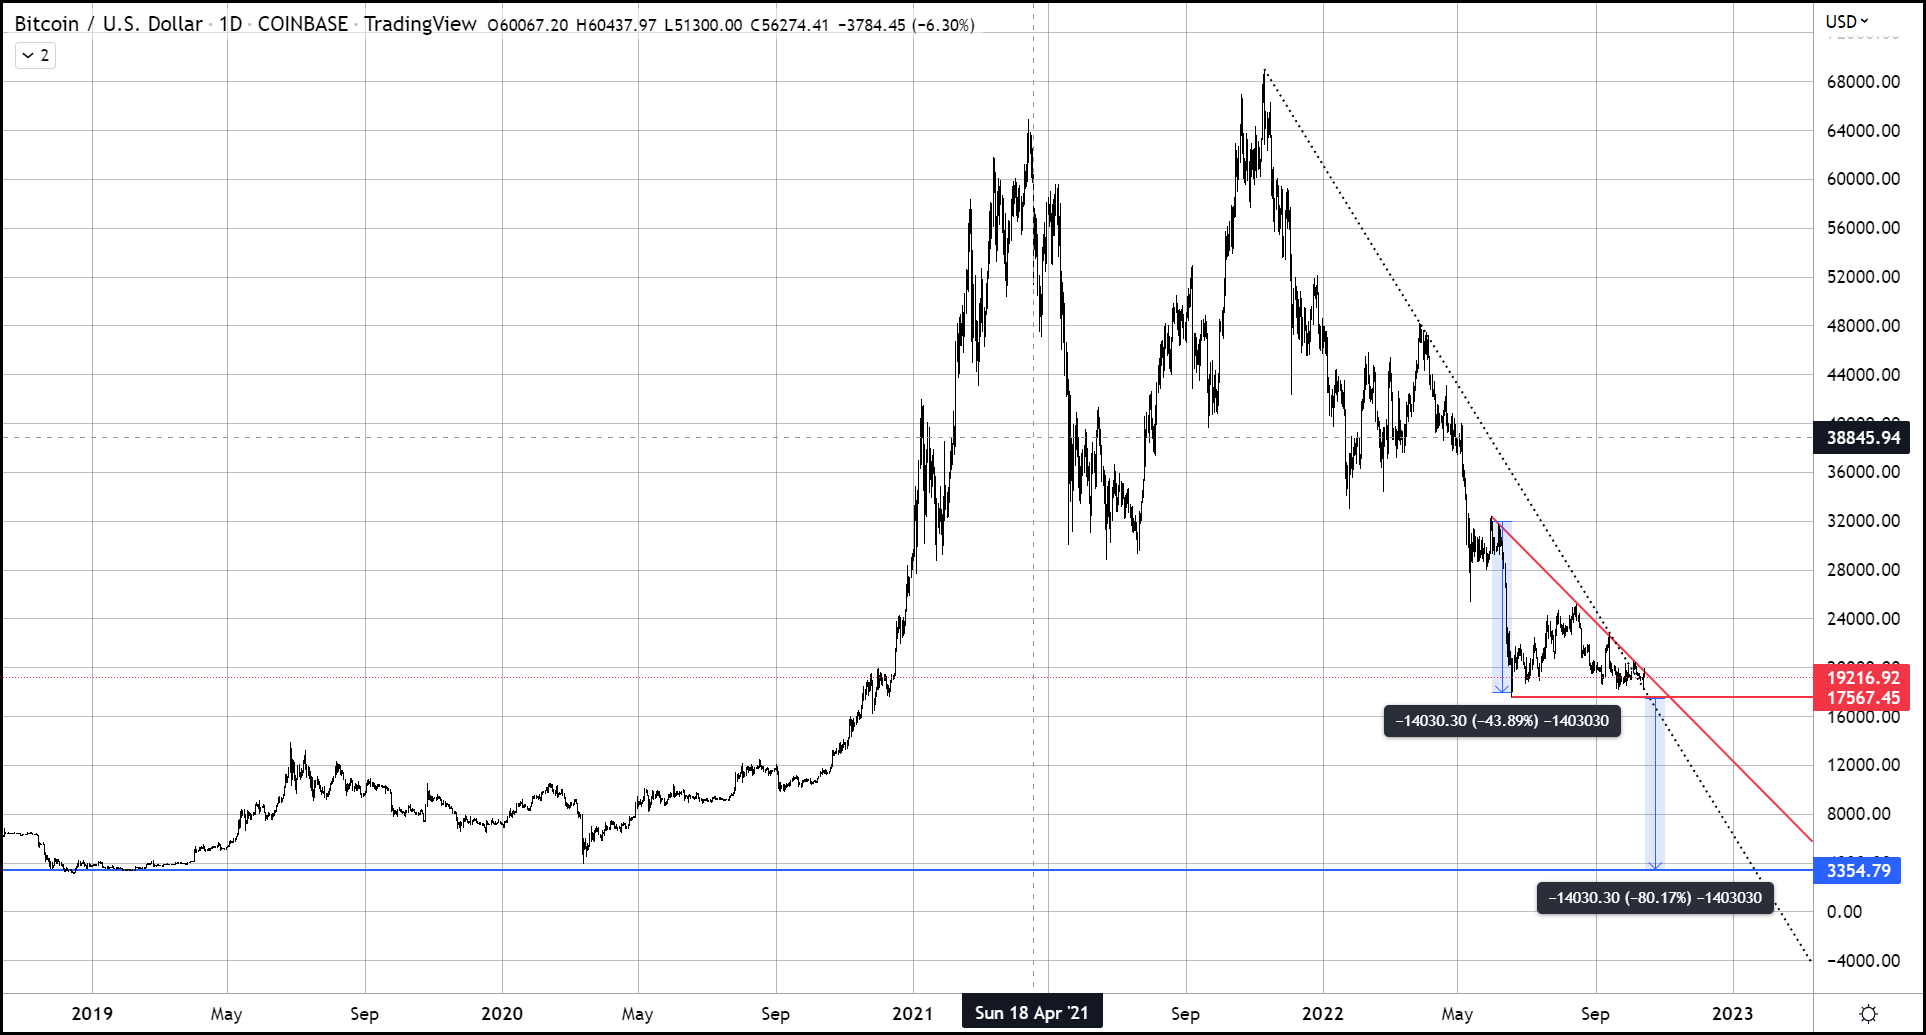
This is a scary proposition if the pattern does play out in the standard excepted format with a breakdown likely moving as far as the widest point in the pattern. When we do this calculation, we see that it would call for another 80% decline. That would shock a lot of bitcoin traders should we see this occur. The spooky thing is that sized move would take us to the exact bottom of 2019 and the covid crash in 2020. So, there is some confluence here suggesting that this in fact could be possible. Another drop of $14,000 hasn’t been my call, I have been calling for the price of $14,000 to be the bottom and not a $14,000 decline. Nonetheless, it is something traders need to be aware of.