BTC and ETH current wave count and ranges

Ethereum and Bitcoin are posting their first daily gains this week while they both are trading near the top of their current ranges.
Bitcoin’s range is defined by a compression triangle drawn from connecting the lows reached on June 18th and July 13th and extending forward in time, the same method is used for the resistance trendline using the highs of June 6th and July 30th.
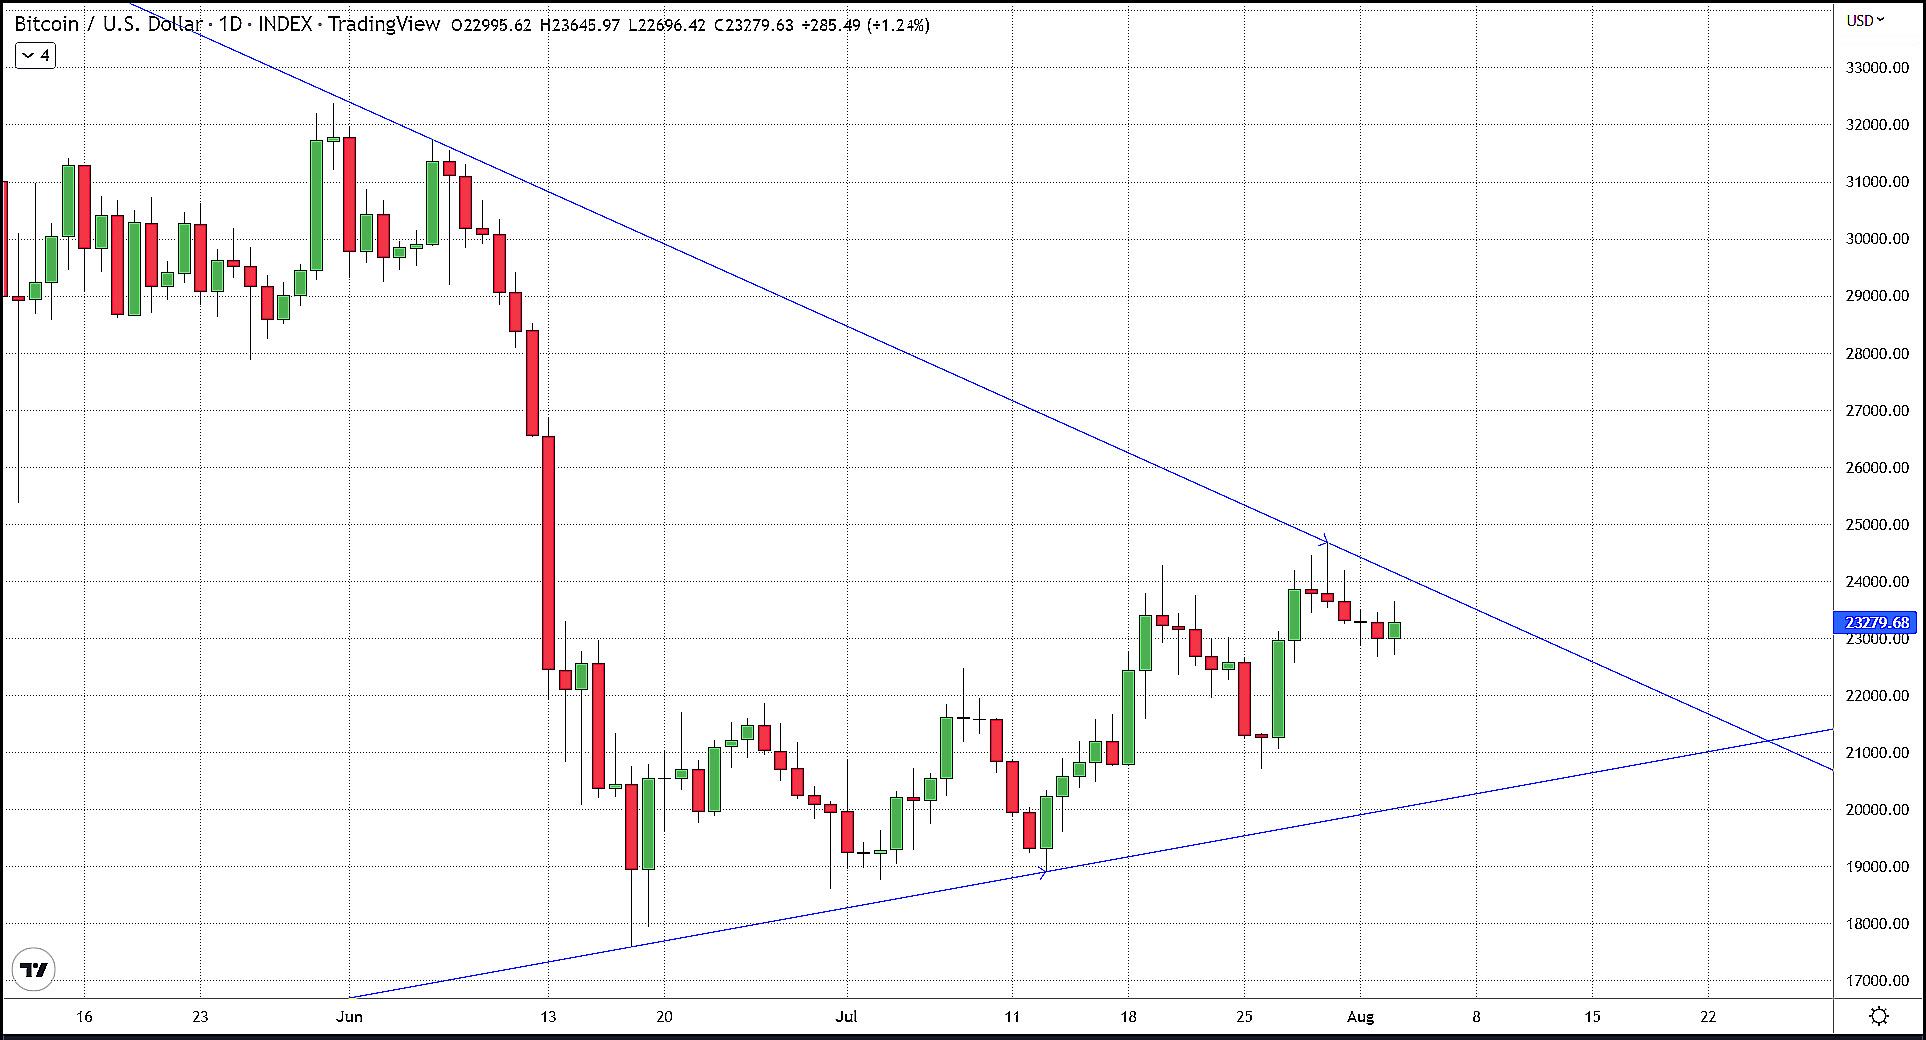
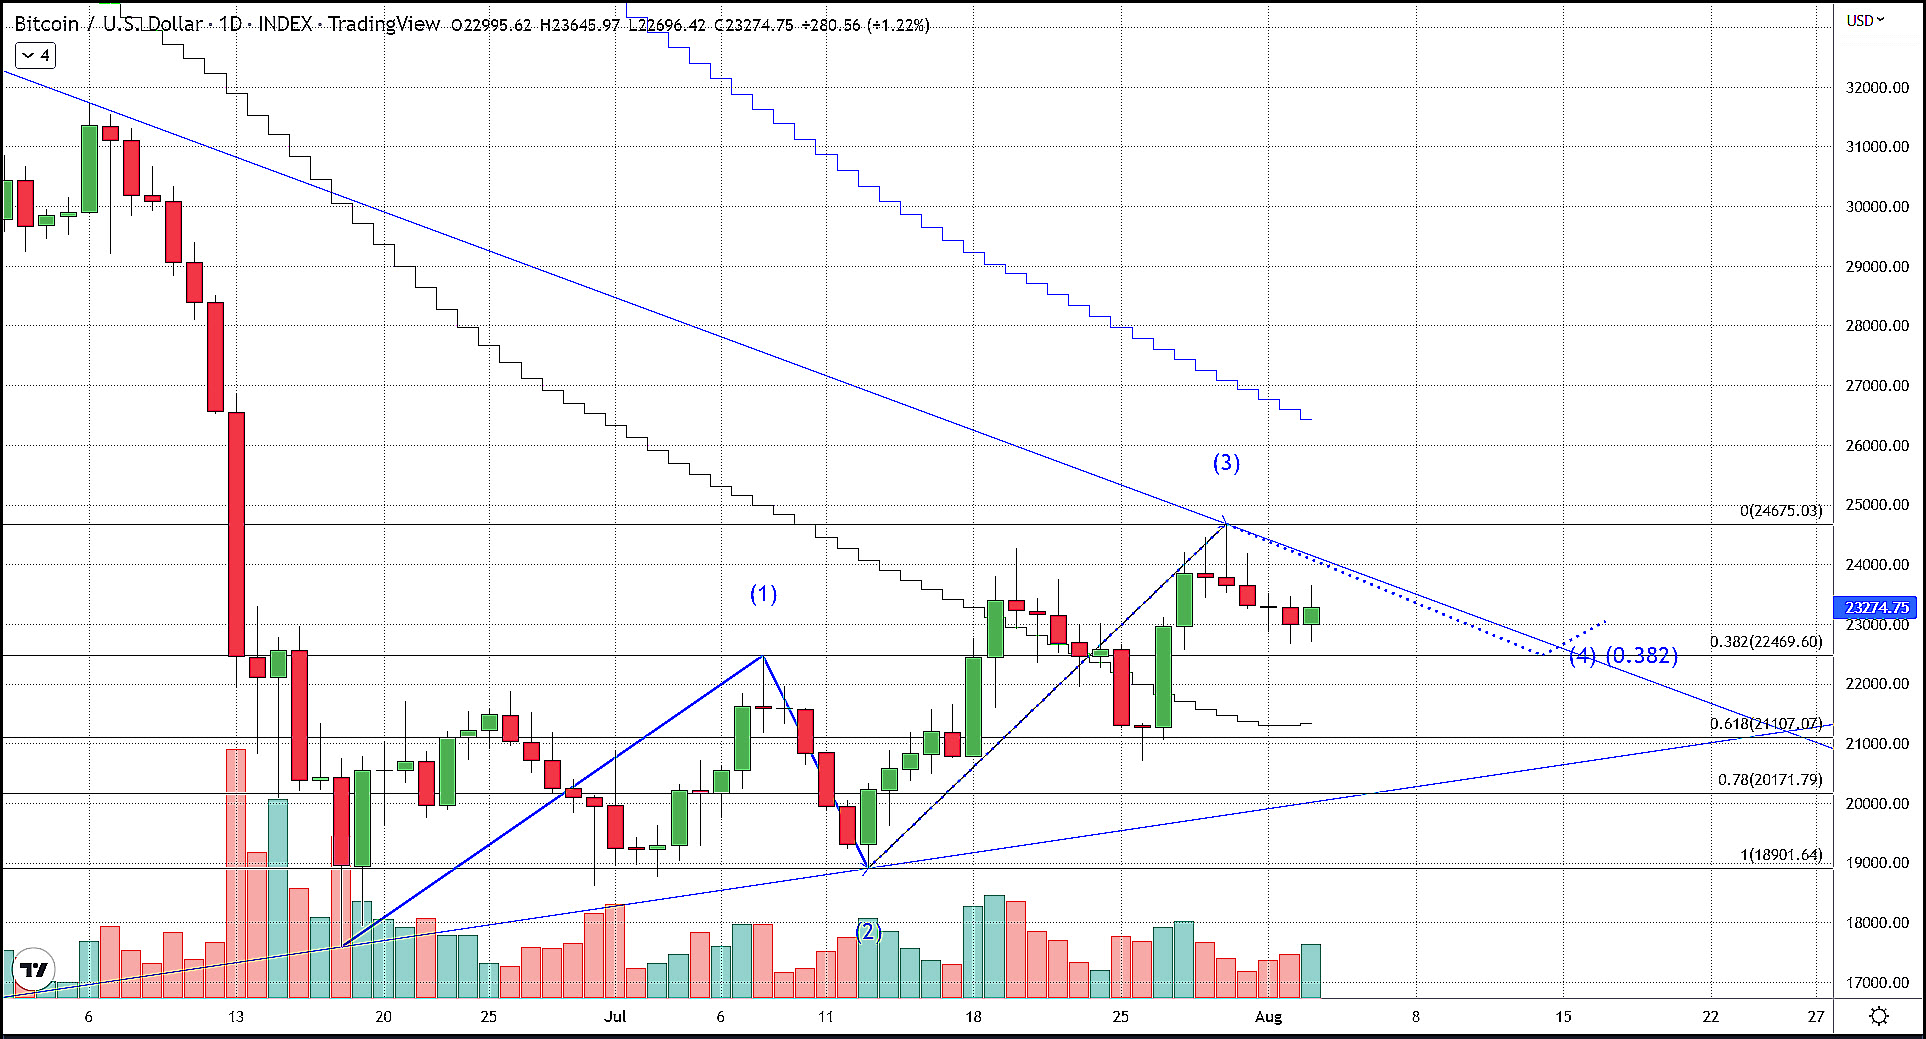
As you can see on the chart above Bitcoin has been hugging close to the upper trendline since July 30th. The descending upper trendline and the ascending bottom trendline create a compression triangle for BTC in which the bottom of the triangle or wedge pattern coincides with the 78% retracement just above the $20,000 level. However, there are several support levels above that price comprised of the 50-day SMA at around $21,300 and the 38% Fibonacci retracement at approximately $22,500. According to the Elliot wave count for the daily timeframe is a bull count where the most likely scenario involves a bounce off of the 38% retracement which would complete a 4th wave. If this indeed comes to fruition, the following fifth impulse wave would certainly blast BTC out of the wedge towards higher prices.
As for Ethereum, it currently resides towards the bottom of a parallel trend channel that began on July 13th from the lows near $1,000. Ether does have resistance inside of this channel that has almost precisely marked the highs of the last 7 days, the resistance I am speaking of is the 100-day SMA.

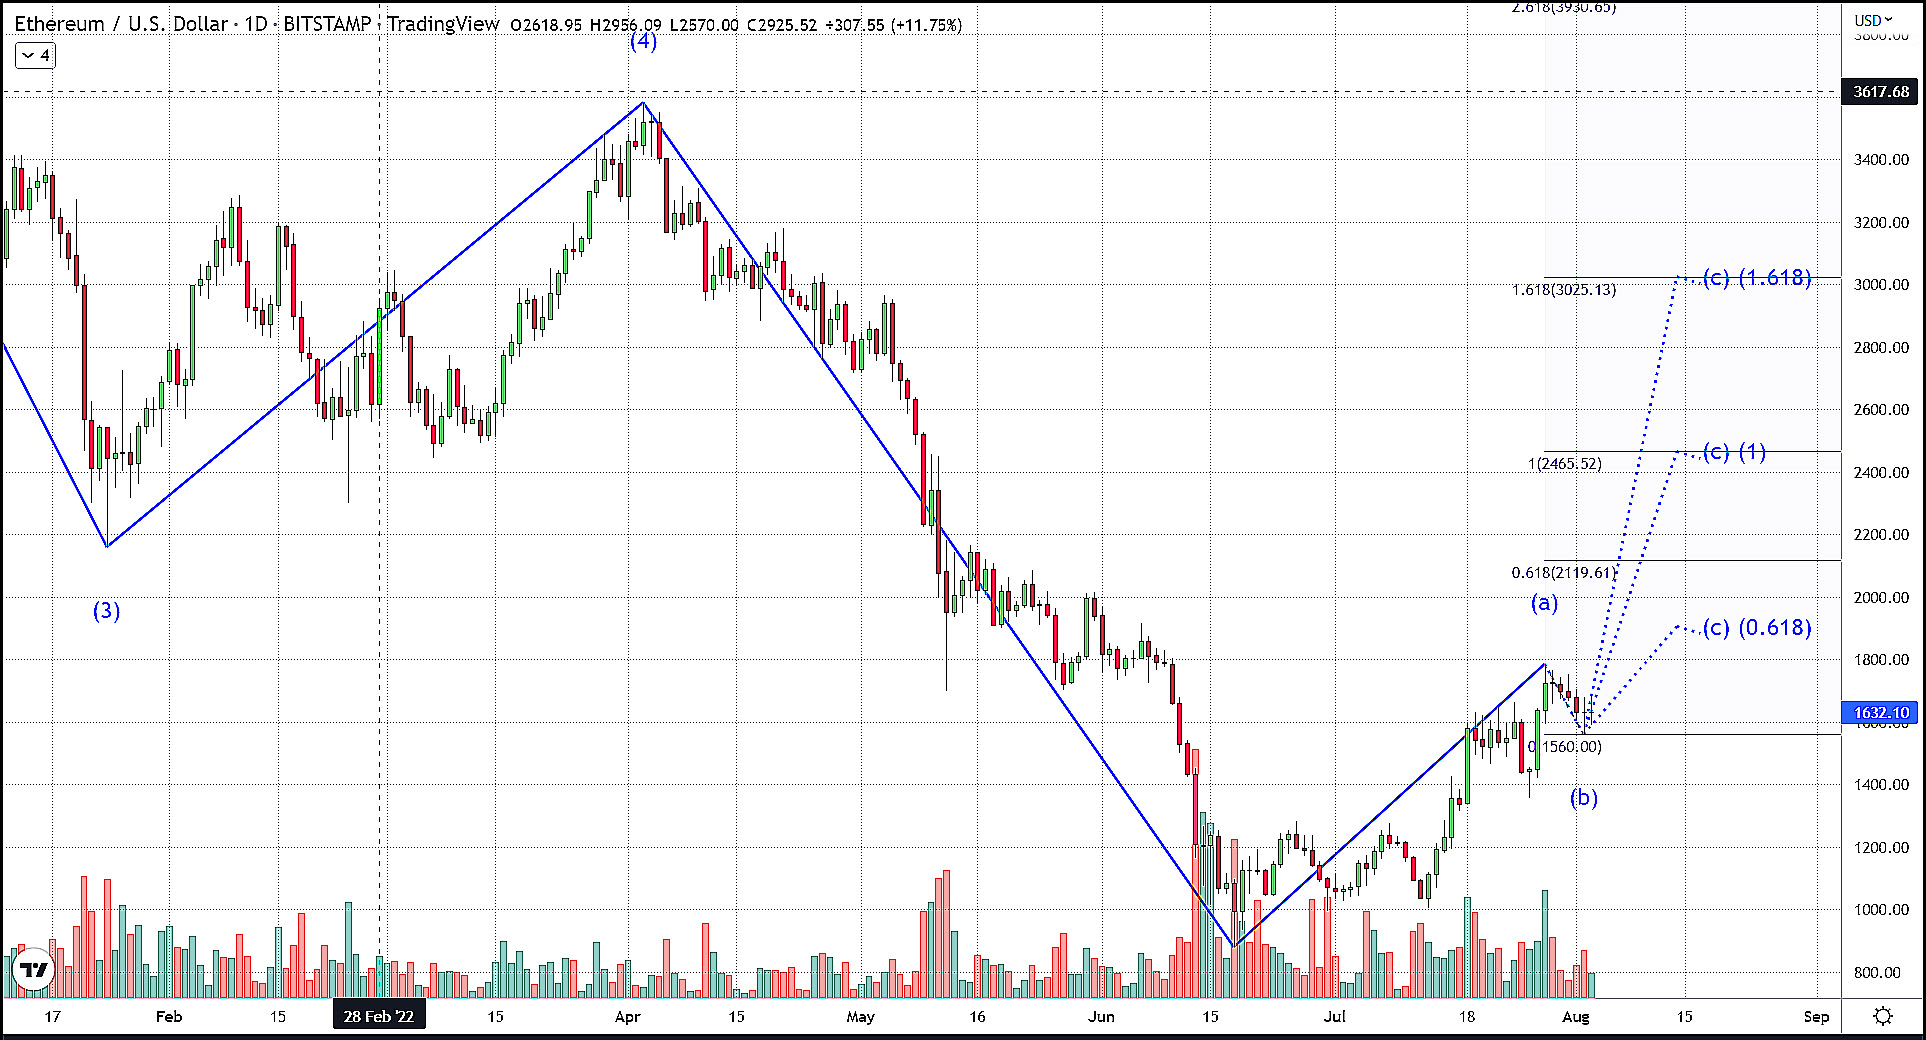
The Ethereum wave count on a daily time frame is looking forward is extremely bullish, which lines up to the fundamental outlook as well as my personal opinion. Ethereum is still in a bear count however it is in the corrective phase so in other words it is in the bullish phase at the end of a bearish cycle. We completed our A wave to the upside on July 28th when it reached prices not seen since early June. Now we are in the midst of a B wave to the downside which could go as low as $13,500, but it doesn’t necessarily have to go that low. If the B wave were to conclude with today’s higher pricing (which is entirely possible with the “Merge” set to happen next month) the wave count is forecasting for the final C wave to bring Ethereum at minimum to $2,100 and as high as $3,000 which is the 1.618% Fibonacci extension of Wave A.
Ethereum remains more promising as it has been for the last few weeks, expect that to continue. Since the B wave in ETH has yet to finalize we recommend traders who follow us and took our trade recommendation to go long Ethereum on July 18th should keep protective stops loose to avoid getting stopped out and missing what is adding up to a massive rally in Ether.