Did support flip to resistance, where could BTC head this week?

Bitcoin is having a bad start to the month of August with $20,000 appearing to have flipped to resistance. Following the weekend and Labor Day which contained tight volume and little volatility, Tuesday’s trading was decisive and to the downside. As of 5 PM, ET Bitcoin is trading at a loss of nearly $800 or 4.4% for the day. So, with the support of $20k now becoming possible resistance where could we head to this week?
To give the shortest possible answer, $17,779.
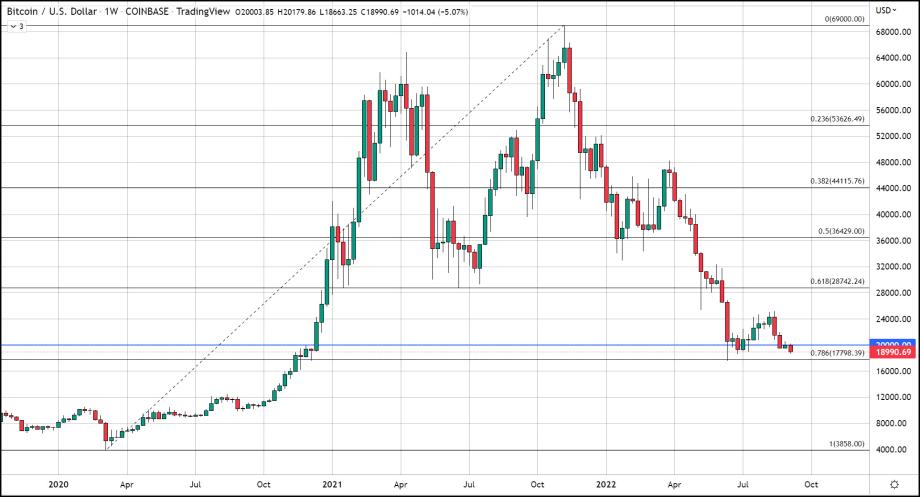
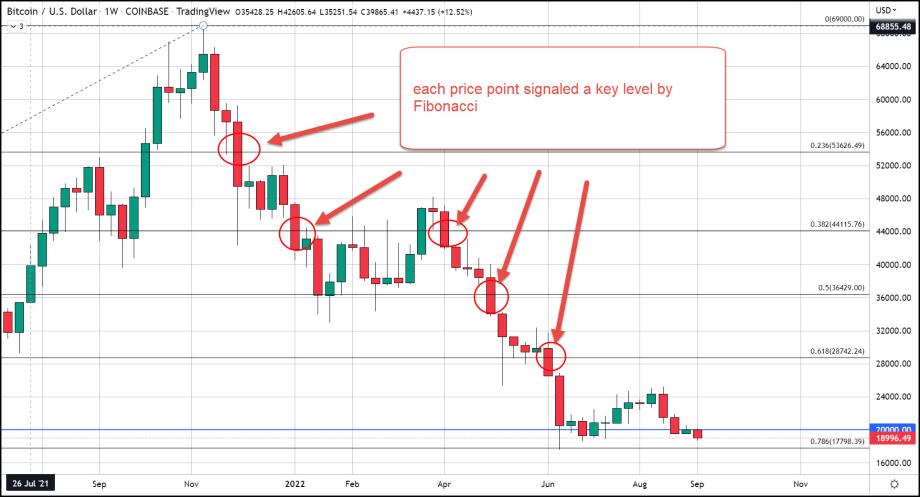
Now I will elaborate as to why, and why that is only a temporary target. The Fibonacci data set that has given us great incite the entire way down from the top at $69,000 is still relevant today. I successfully marked the triple bottom with its 61.8% level and at each of the most commonly accepted Fibonacci values, 23.6, 38.2, 50, 61.8, and 78.6 all so far (except the 78.6) have correctly mapped points at which the price would freefall if taken out. The last level left to fall under this fate is $17,779 the 78.6% Fibonacci retracement level using the data set of the 2020 March lows at $3,858 to the all-time highs at $69,000.
The level of $17,779 was touched briefly in the week of June 13th and marks the lowest price Bitcoin has traded since hitting its record high in November 2021. Furthermore, a correction beyond the 78.6% level becomes harder to justify that we are experiencing a correction rather than a pivot to a bear market. However, correct beyond a 78% retracement is exactly what Bitcoin has done before only to recover and rally once more. We are in the 5th iteration of Bitcoin’s corrective stage of its long-term cycles. The corrective leg of these cycles often goes much deeper than 78% which is why many months ago I stated that $17,779 was the minimum that Bitcoin would fall to and the maximum was a low of roughly $13-14,000.
That is why the 78% retracement is our clear short-term price target that will likely be seen this week.

