Market dominance revisited
Last December (Dec. 9th), we discussed using Bitcoin’s dominance level to predict price action the following day. The article illustrated how it could have effectively been used to predict whether the following trading day results in higher or lower pricing. We outlined a strategy focused on BTC dominance above or below 40%. Significant dips below 40% dominance would signal that a price decline was likely the following day. And on the other hand, a significant spike in dominance would be followed by a spike to higher pricing in the following trading session.
The examples that we showed spanned from September to December of last year and included some of the largest most significant moves over the past few months. Today I want to show how that same technique has correctly forecasted the following day’s direction and how you can incorporate this study into your own trades.
This technique is best suited for day traders or short-term traders as they do not tell us anything about the market’s overall trend. That being said, the 40% market dominance level has been extremely accurate in forecasting short-term price moves, which could be extremely beneficial for short-term traders, as well as serve as a warning signal to longer-term traders so that they may get out of a position the day before the price moves south.
To use this metric one must disregard whether or not the current dominance level is above or below 40% and instead must focus upon when that level moves from above to below or from below to above 40%. In our chart below we have daily candles overlaid on a market dominance area chart with the yellow line representing 40% market dominance. As you can see from Dec. 13th to Dec. 27th, there are only two instances where the dominance moved to the other side of the yellow line. From Dec. 27th up until Jan. 3rd, we have had four occurrences of moving to the other side of the yellow line (from below 40% to above it or vis versa).
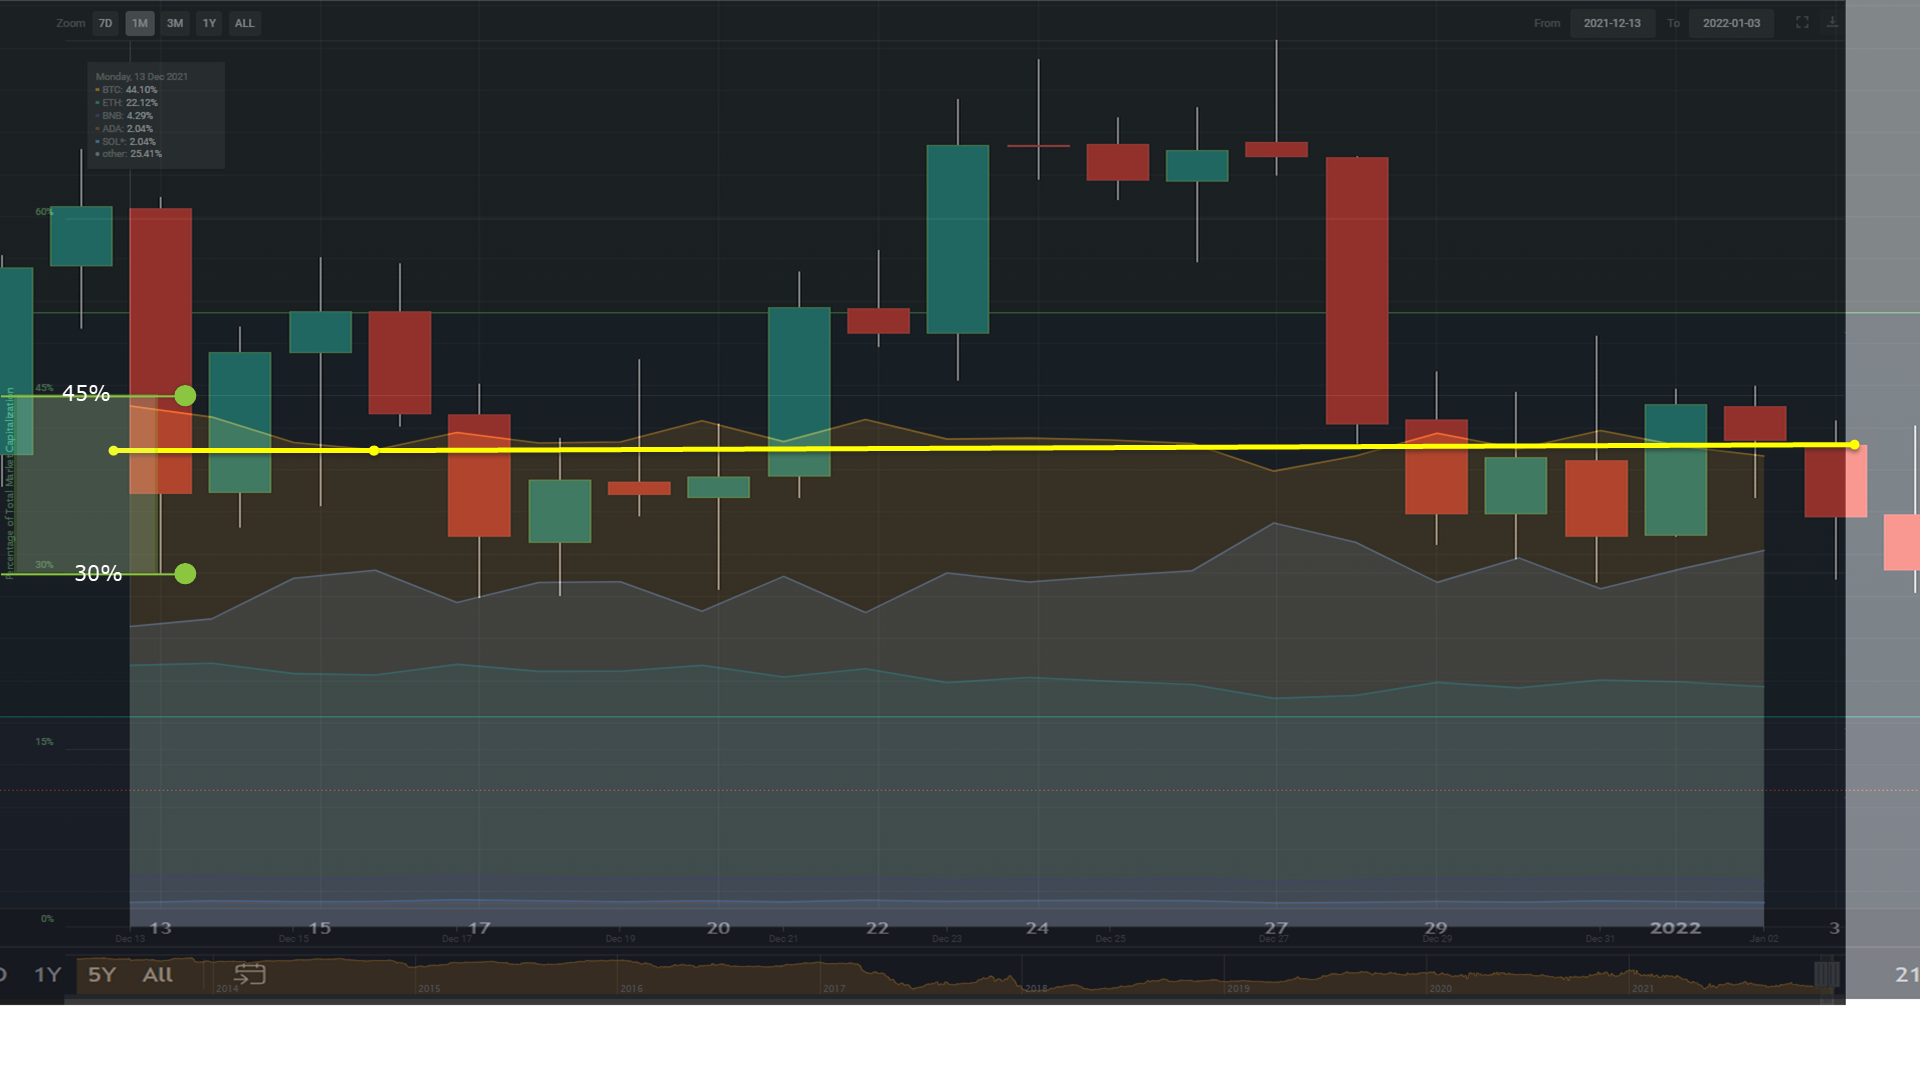
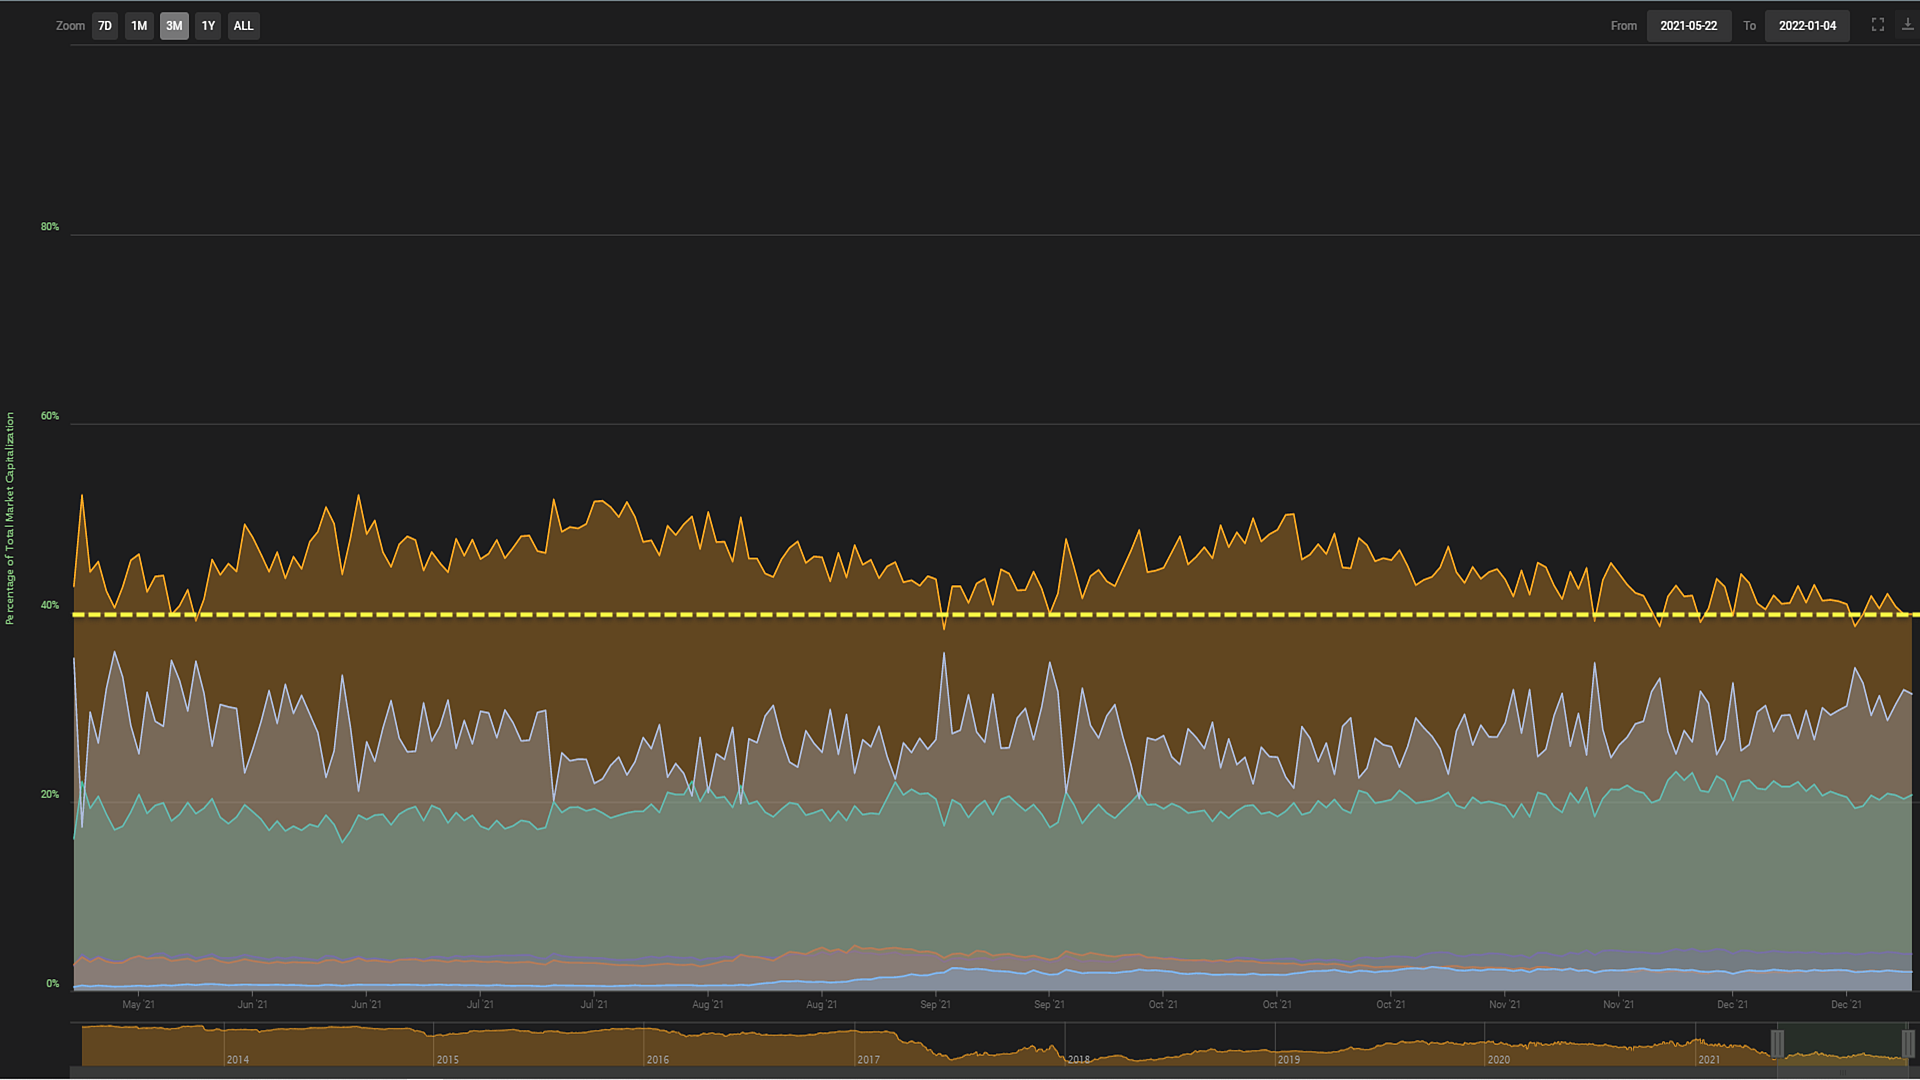
Another interesting pattern that can be seen through a market dominance chart (Coin360) is what coin(s) obtain the market cap. When BTC temporarily losses it. Ethereum tends to gain or lose dominance in unison to Bitcoin. In comparison, Ethereum’s MCD has remained relatively stagnant like that of Bitcoin’s, remaining within a range of 19% - 22%. The next three coins in terms of market dominance (excluding tether), Binance coin (BNB), Solana (SOL) and Cardano (ADA), have also been relatively unchanged with all demanding between 2% and 3%. It is the small-cap coins that have been growing over the past three months.
Coin wars – Rise of the clone army
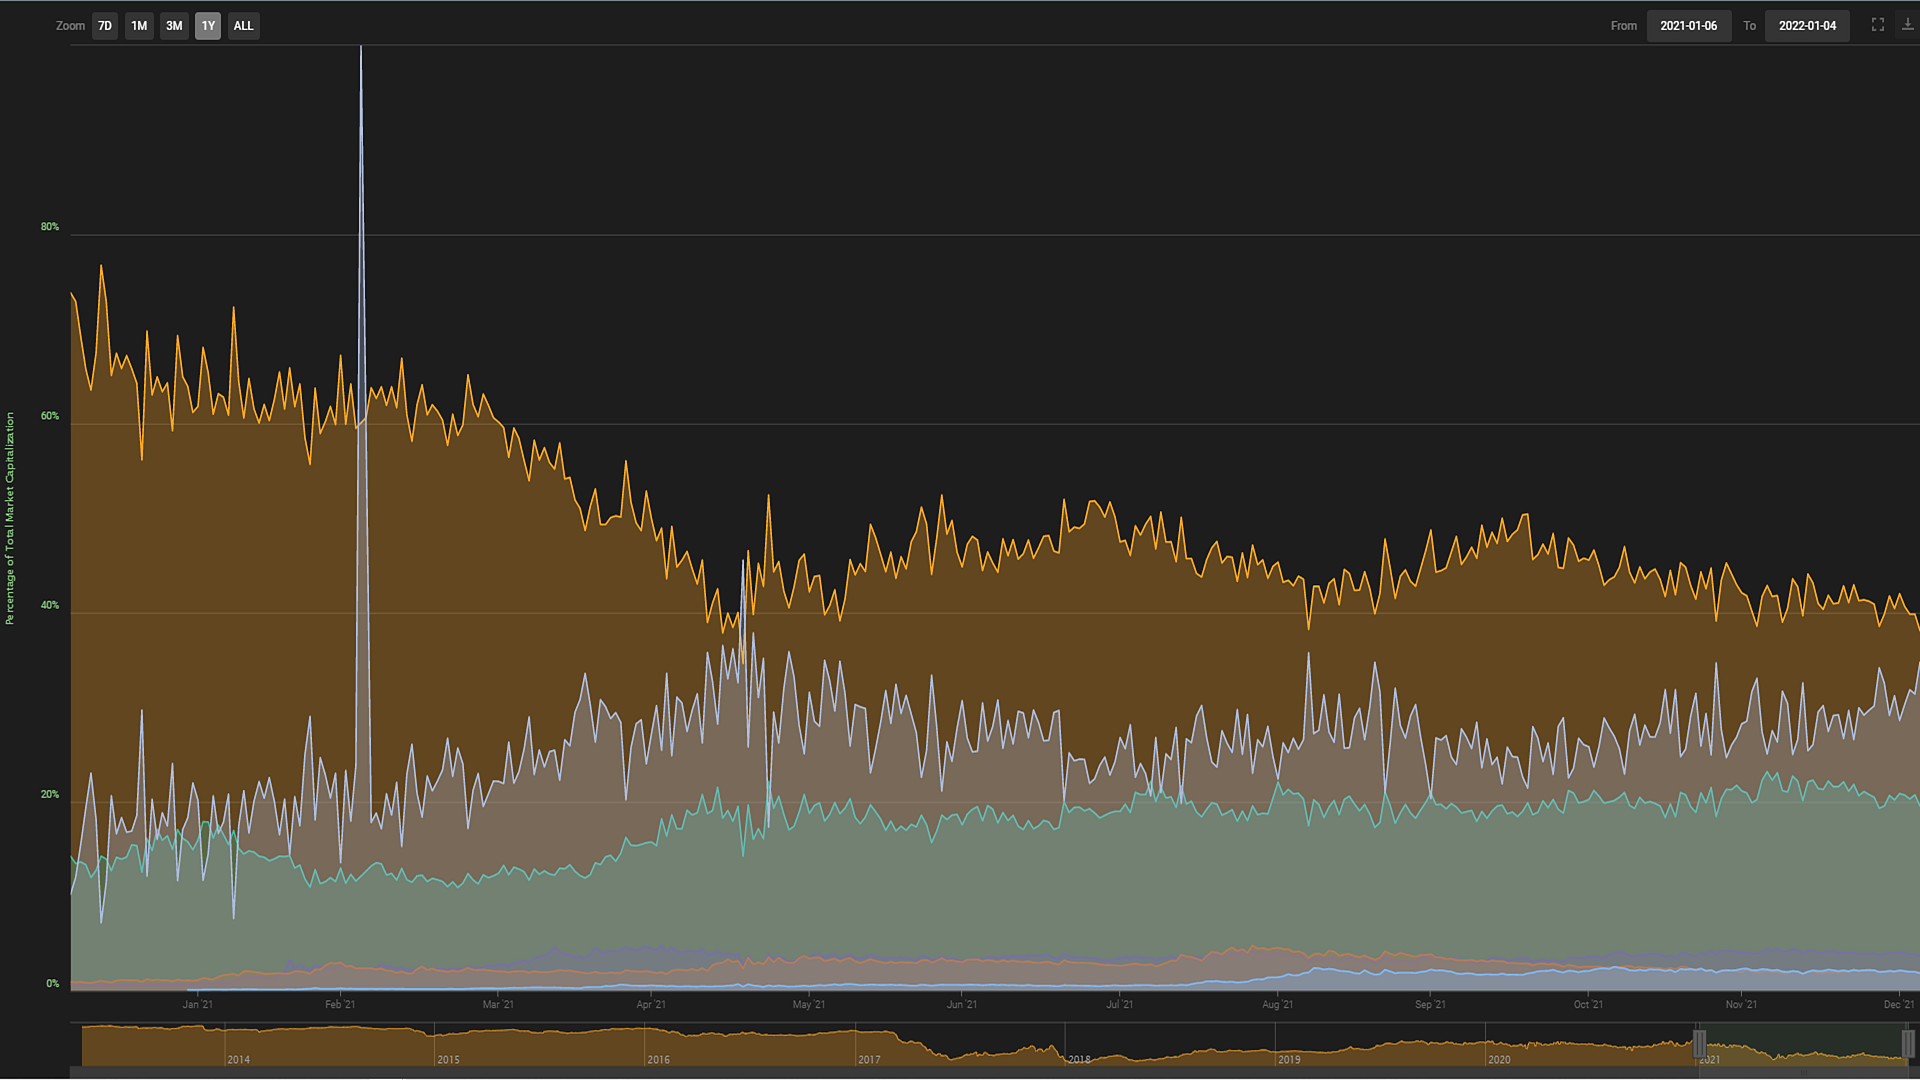
Throughout 2021 the entire market dominance of all small-cap coins combined have had short-lived dramatic spikes as high as 45%, but if you remove the noise, you see that the MCD for these coins rose by about 25% last year, making up 10% on Jan. 7th, 2021 and as of Jan. 5th, 2022 represent nearly 35%. They also move inversely to BTC’s MCD and are as volatile as Bitcoin’s. Both BTC and Smaller cap Alt. Coins contain moves that are choppier than that of Ethereum or Solana.
In conclusion, the MCD can effectively forecast the direction of Bitcoin’s move the day following a shift, which can be very useful in short-term trading. It also can be useful in deciphering long-term trends as it points to a move out of Bitcoin and into the hands of its many smaller and younger competitors.