Started from the bottom now were here?

Is a bottom in Bitcoin finally here? If not then where? I have been saying that Bitcoin’s bottom would occur between $17,800 - $13,000 for an entire year now, ever since we came off of our new all-time high last November. To get these numbers for a bottom I simply compared all other parabolic cycles that Bitcoin has experienced and their subsequent corrections, interestingly they all have followed the same basic guidelines. BTC has completed four of these cycles and is in the last stage of its fifth iteration.
These sequences include an explosive rally moving past the previous record high, followed by a deep correction that ranges from 78% to 96% of its upside move. Bitcoin had touched upon a 78% retracement of its current fifth parabolic cycle in mid-June. So, I stated that BTC had hit its minimum retracement level and may now be in its consolidation phase, the last of the three stages in these cycles.
While looking at the four previous cycles of a parabolic rise and fall I realized that in only one instance did a 78% retracement mark the end of its correction (April 2013). Furthermore, it hit its 78% retracement in the same month that it made its new high. This is odd because all of the other cycles had much longer and deeper corrections, but it fit the rest of the criteria for a parabolic rise and fall so that is where I got my forecast of “at least” a 78% correction. Looking deeper into the data it seems that the 78% bottom was an outlier and is an extremely optimistic forecast as the other 3 completed cycles bottomed out between a 92% – 96% retracement and took anywhere from 6 months as long as 22 months to reach a bottom.
Now other than the first parabolic cycle in 2011 the range for a bottom is between 78% and 92%. For our current cycle that is a huge range between $17,800 and $9,000 so to narrow it down, we are going to use another technical forecasting method, Elliot wave.
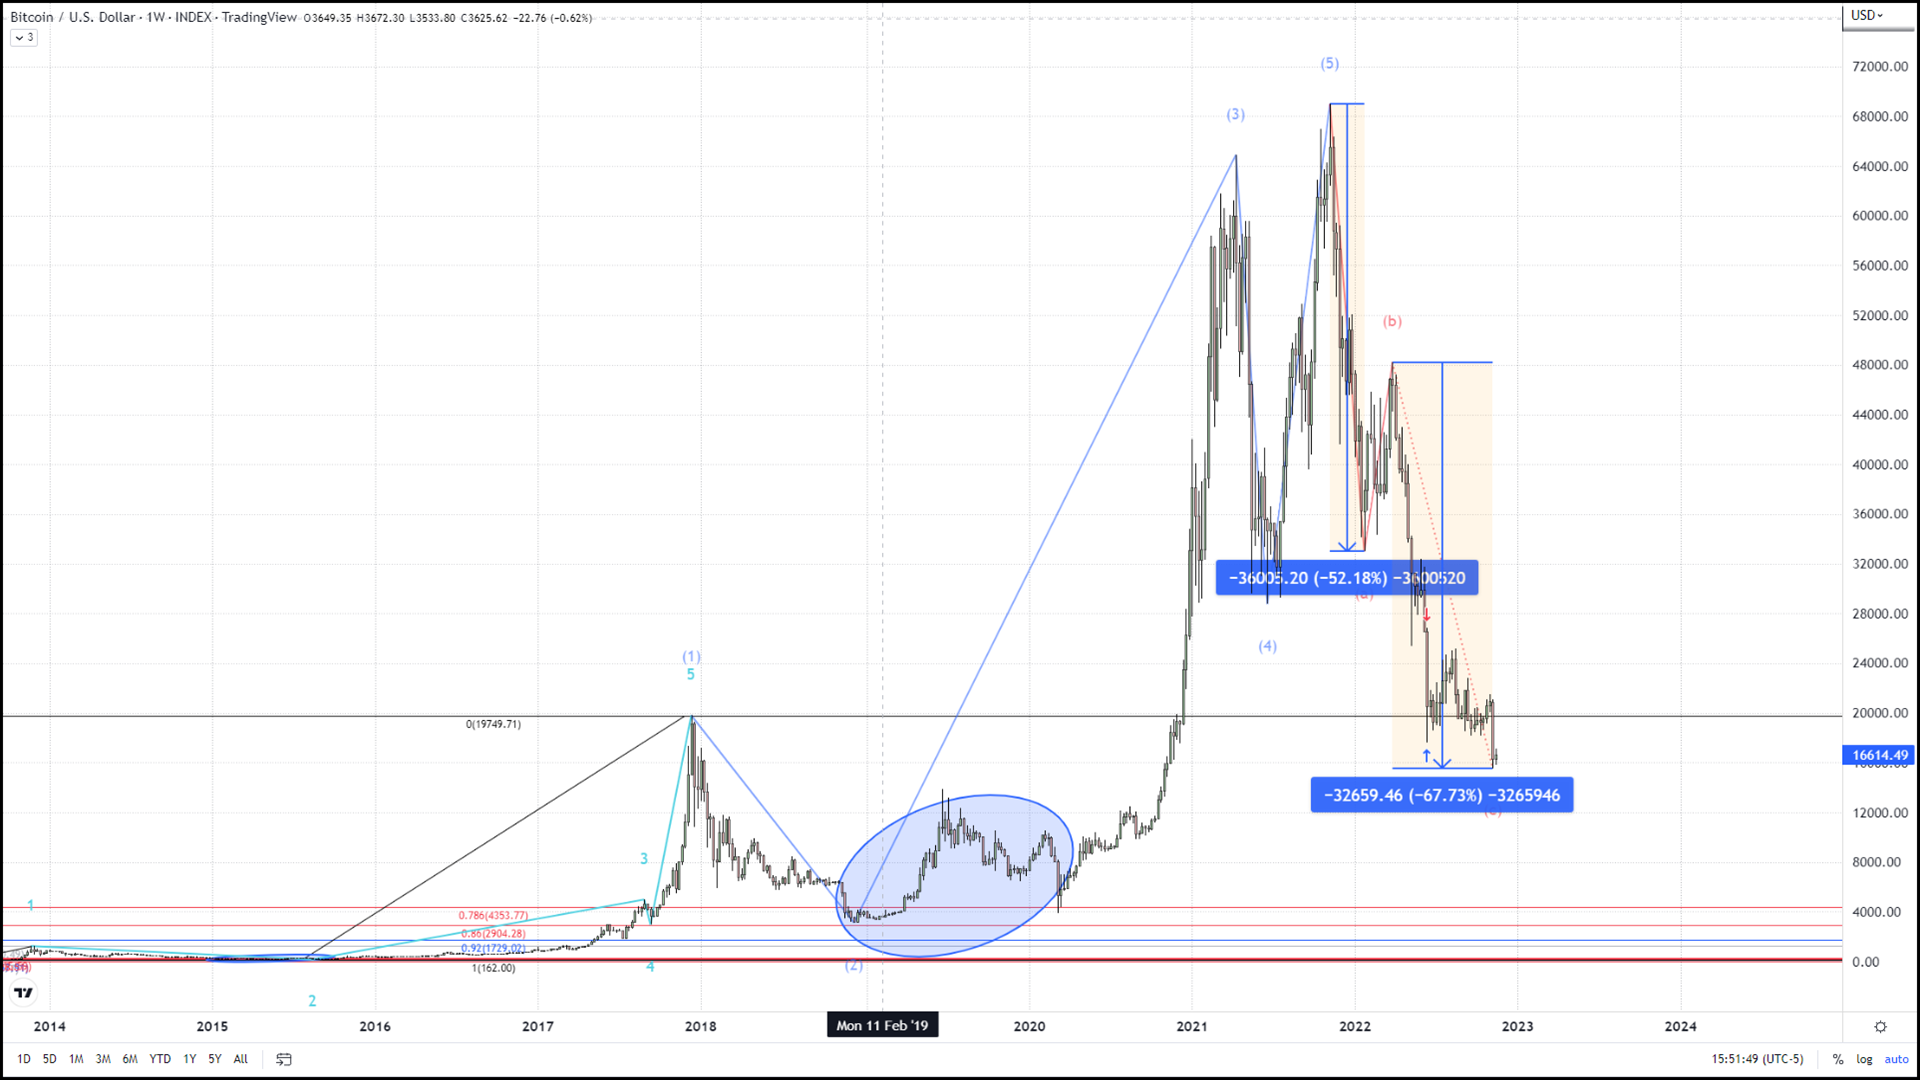
The wave count I find most probable is shown above. Along with the wave count, the weekly candlestick chart shown above also contains two blue arrows outlined in a light beige which simply shows the distance between two points. The first price distance is the length of corrective wave A, the second is the distance that wave C has traveled so far. The most common relationship between wave A and C is a 1-to-1 relationship, which would have our current wave C conclude at approximately $12,500.
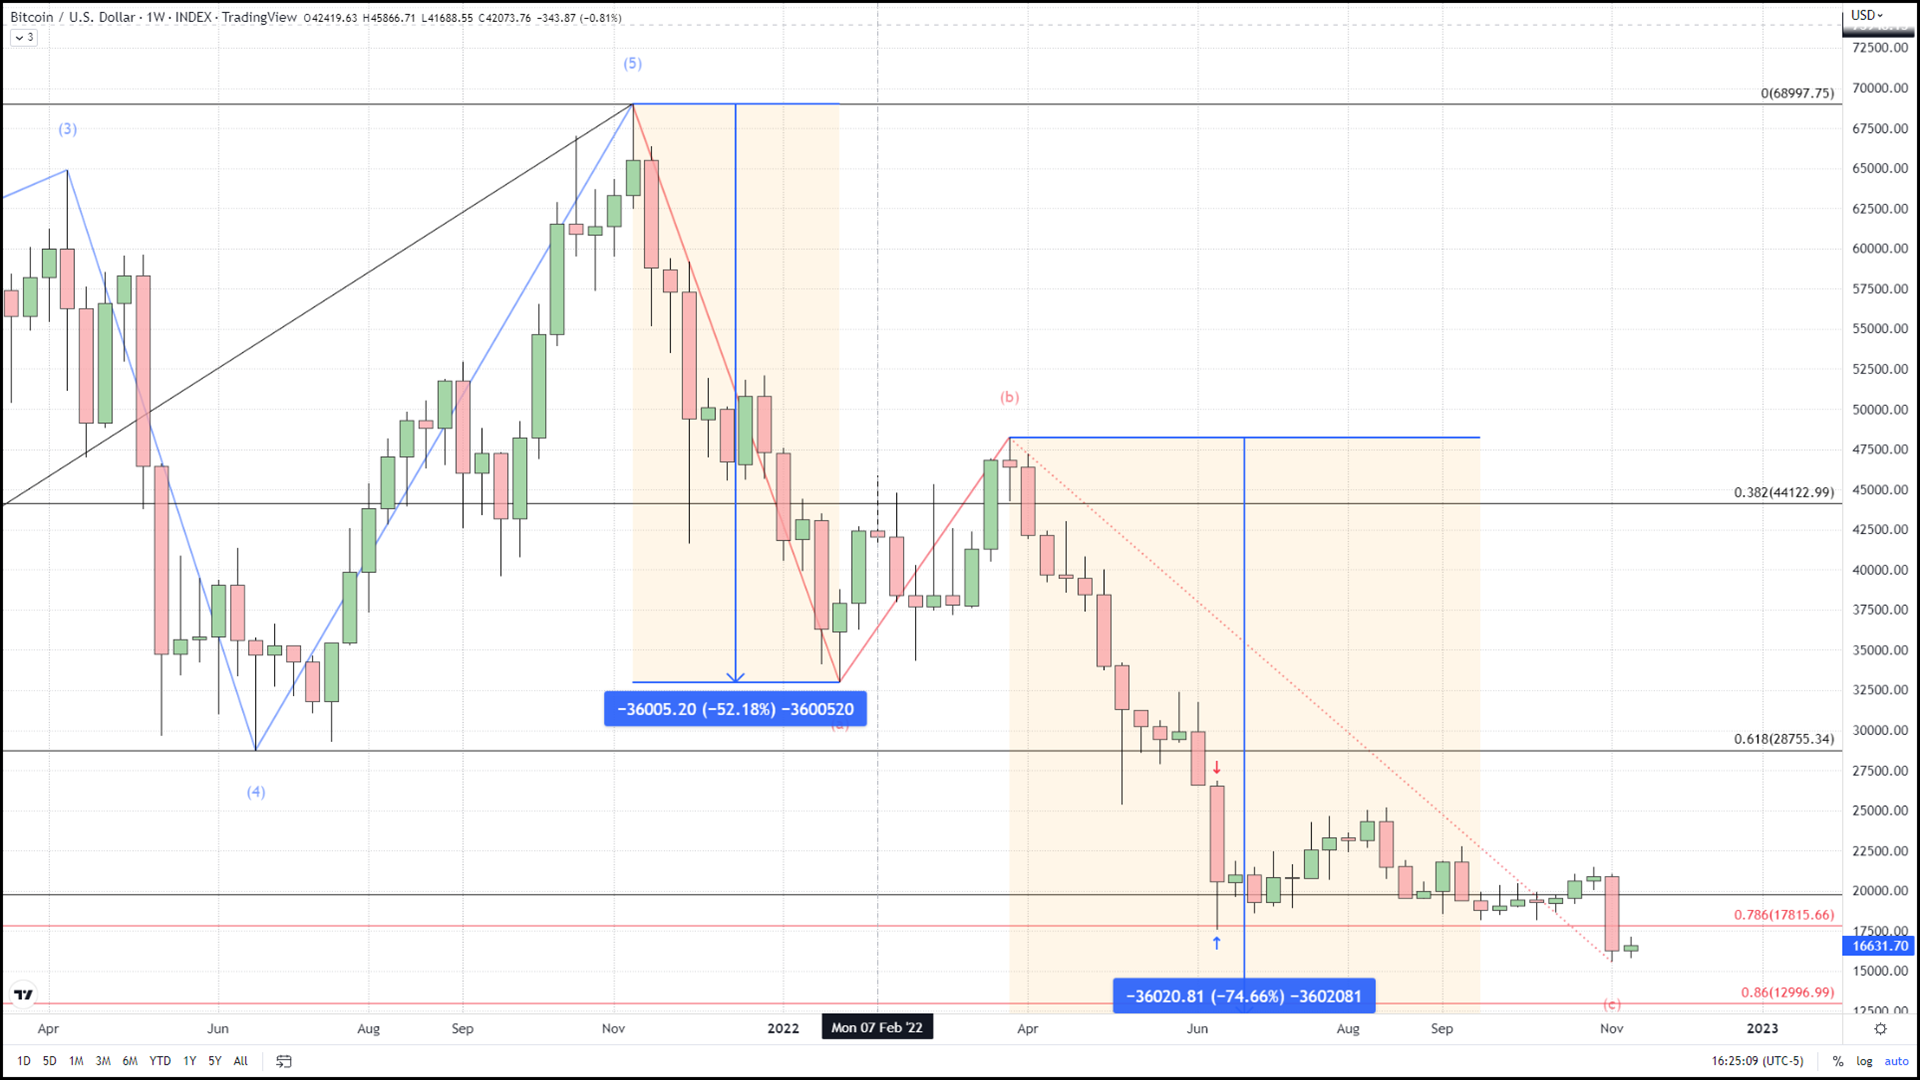
However, I am sticking with my forecast of a bottom in Bitcoin coming in from $14k (2018 top) to $13k (86% retracement). From there expect to see continued low volatility as Bitcoin enters or continues its consolatory period up until Spring 2023 when I believe the next parabolic cycle will begin and take Bitcoin to a new all-time high.