The straw that can break Bitcoin’s back

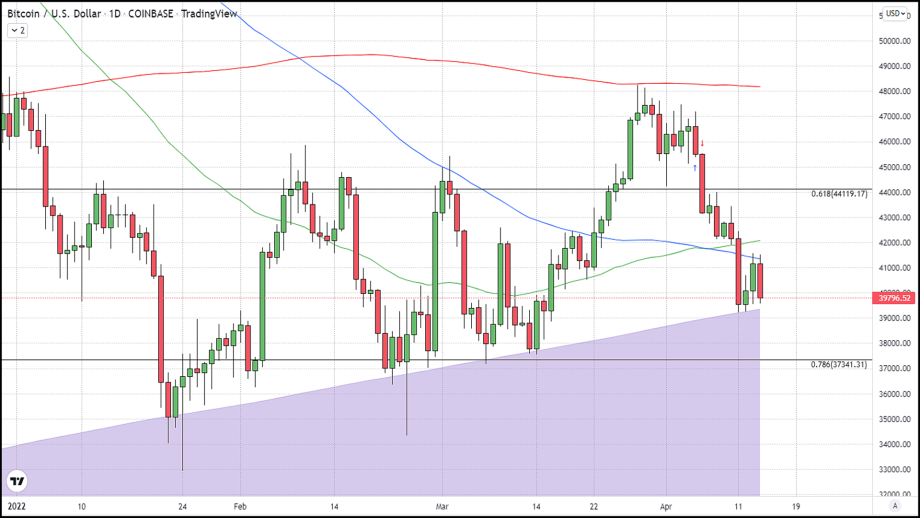
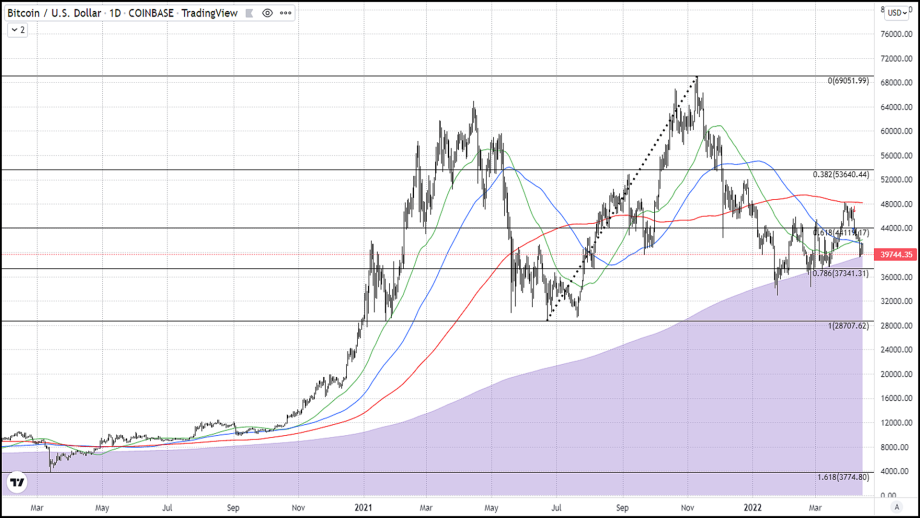
There is a technical indicator that has acted as effective support at least seven times in the past three months. It is this level that, if broken, could lead to the level we spoke about in our last article as the target for the mid-halving point, $30,000. The technical indicator I am referring to is the 600-day simple moving average.
The 600-day SMA has not been of any significance for a long time until January 22nd, when it marked effective support. Since that date, it has marked support or intra-day support eleven times, and as of 3:30 PM ET, pricing is only $400 above the 600-day SMA at approximately $39,750.
A more widely used moving average, the 100-day SMA, had flipped from being a support level to resistance over the last two days when Bitcoin attempted to move above it and did slightly on an intra-day basis but failed to close above it in both instances.
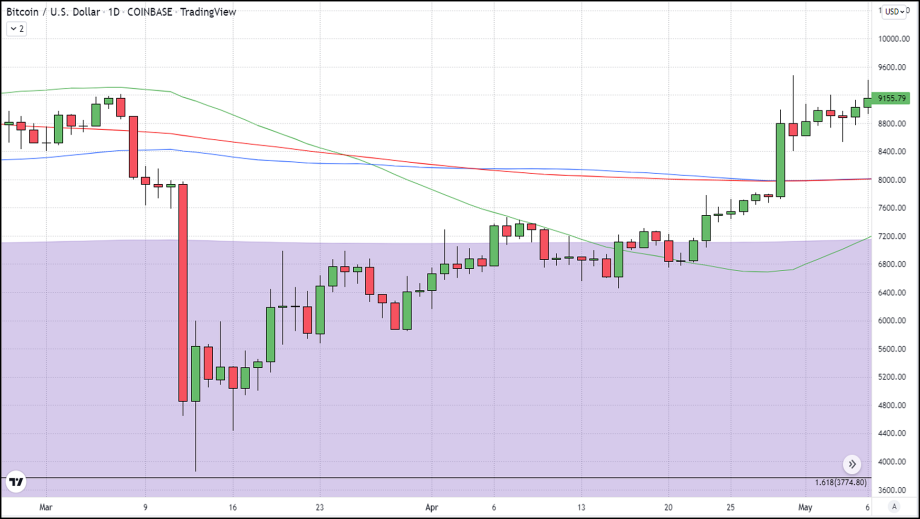
What I found very interesting was that the last time the 600-day was below pricing was also one of the few times in the past two years that the 100-day was acting as resistance. The time in which I am referring is the “Covid Crash” on March 12th, 2020. That was the last time we broke below the 600-day SMA and in two days BTC lost close to 50% of its value.
With the 100-day acting as resistance and the 600-day acting as support something has got to give. Meaning a breakout in either direction is imminent with the two moving averages converging and moving closer together. Our recent studies suggest that the break will likely be to the downside and the only level of support that would stand in the way of $30,000 is the 78% retracement at $37,350. However, the 600-day represents a more critical level that BTC must hold in order to avoid a revisiting of last summer’s lows ($30,000).


