Bitcoin is still bullish long-term, upgraded neutral mid/short-term

Bitcoin’s mid-term outlook was looking exceedingly bearish up until the last week of September when Bitcoin experienced a significant bump. This swing to the upside mitigated 3 consecutive monthly declines scoring the first monthly gain during the last 3 months. This altered the short to mid-term prospect altering it from bearish to neutral.
Mid-term picture
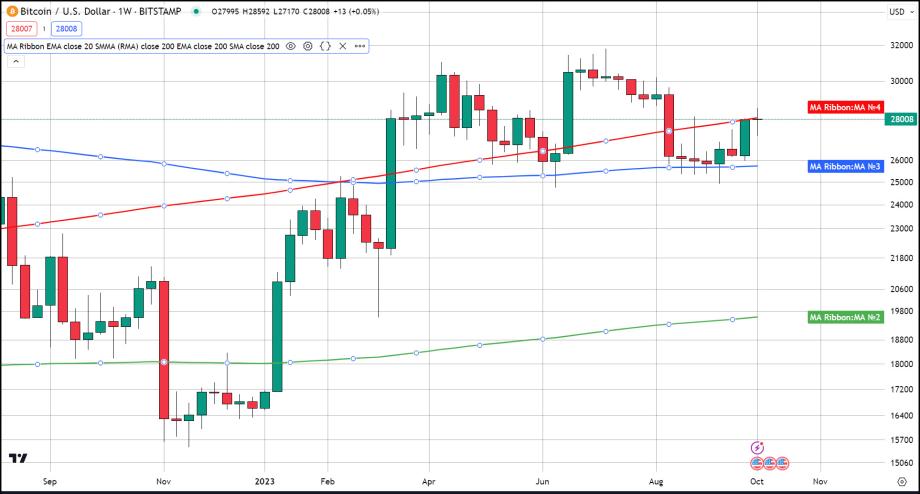
Bitcoin has been sandwiched between 2 critically important moving averages, the 200-week simple moving average (SMA) and the 200-week exponential moving average (EMA) since the middle of August or about 45 days. For most of that time, BTC hugged the support of the 200-week EMA but is now at the top of the range touching upon the resistance at the 200-week SMA.
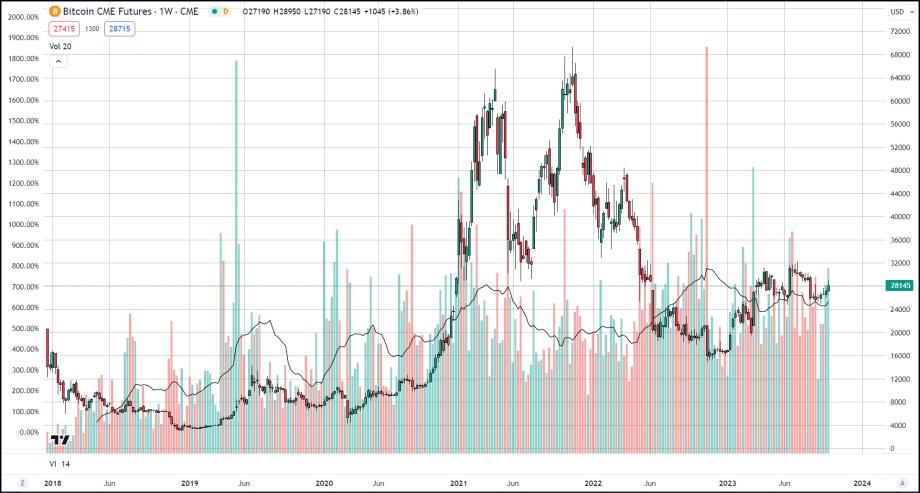
Spot volume has at least remained stable for the past few weeks, when we see a rise in spot volume accompanied by a price spike, we can expect that the next bull run is beginning. As far as Bitcoin’s CME futures contracts volume did not diminish much if at all. This informs us that interest from high-level traders and institutions has not diminished recently. Currently, The CME’s volume is standing at 50,000 contracts traded this week, at five coins per contract which is equivalent to 250,000 Bitcoin traded on the futures exchange this week. Overall volume in the CME is up by 800% since its start in January 2018.
Long-term picture
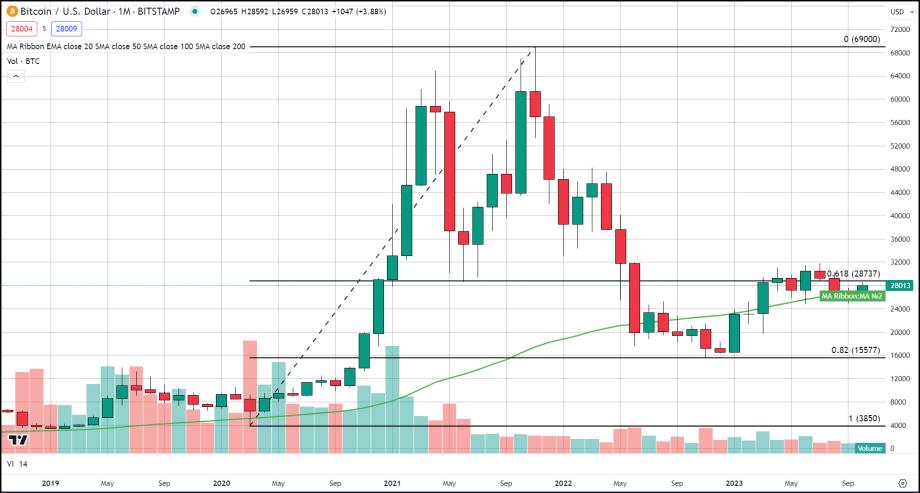
Moving to a monthly chart we see that the 50-month SMA is once again acting as support after BTC moved above it on the pivotal week that began on September 24th. However, the long-term 61.8% Fibonacci level at $28,750 is acting as a ceiling capping any price advance. The retracement stretches from the March 2020 lows to the all-time high of November 2021 and the 61.8% level has served both support and resistance at pivotal moments in the recent past such as the triple bottom that occurred between the last two all-time highs between May and July of 2021. Another aspect of Bitcoin’s long-term technical picture is the reduced trading volume at least in spot markets which demonstrate the lack of enthusiasm from retail traders.
Short-term picture
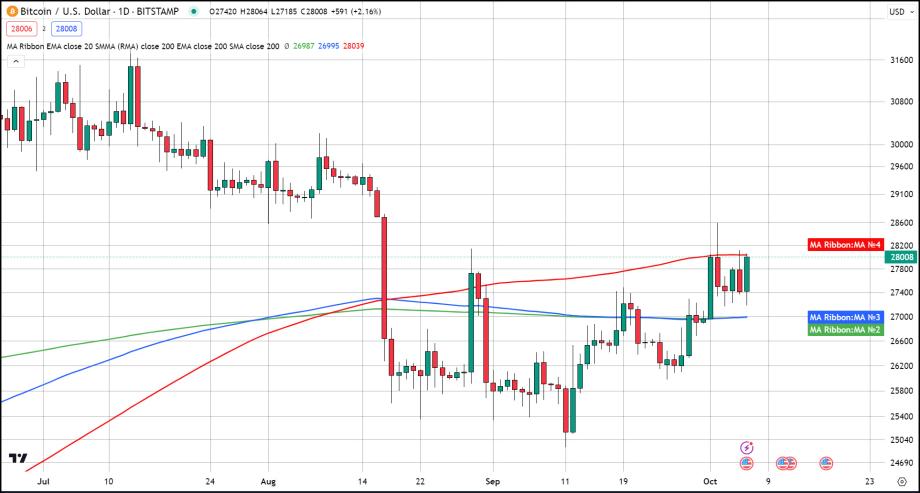
Interestingly when we switch to a daily time frame the same moving averages define current support and resistance as in a weekly time frame. In both time frames (daily, weekly) the 200-cycle simple moving average is acting as resistance and the 200-cycle exponential moving average is acting as support. A phenomenon that I personally have never witnessed in a market before, that fact makes it hard to decipher what to make of it other than these levels even more important, and a break above the 200-cycle SMA, or below the 200-cycle EMA would usher in a strong move to either direction.


