Bullish continuation pattern in BTC could propel prices to $85k

Bitcoin's price action over the past couple of months has formed an interesting technical pattern that traders will want to keep a close eye on. After hitting a new all-time high just below $74,000 on March 14th, BTC pulled back to an intraday low of $56,500 on May 1st.
Since that brief dip below $60,000, Bitcoin has been making a series of higher lows, while the highs have been capped around $72,000. This has created an ascending triangle pattern on the charts.
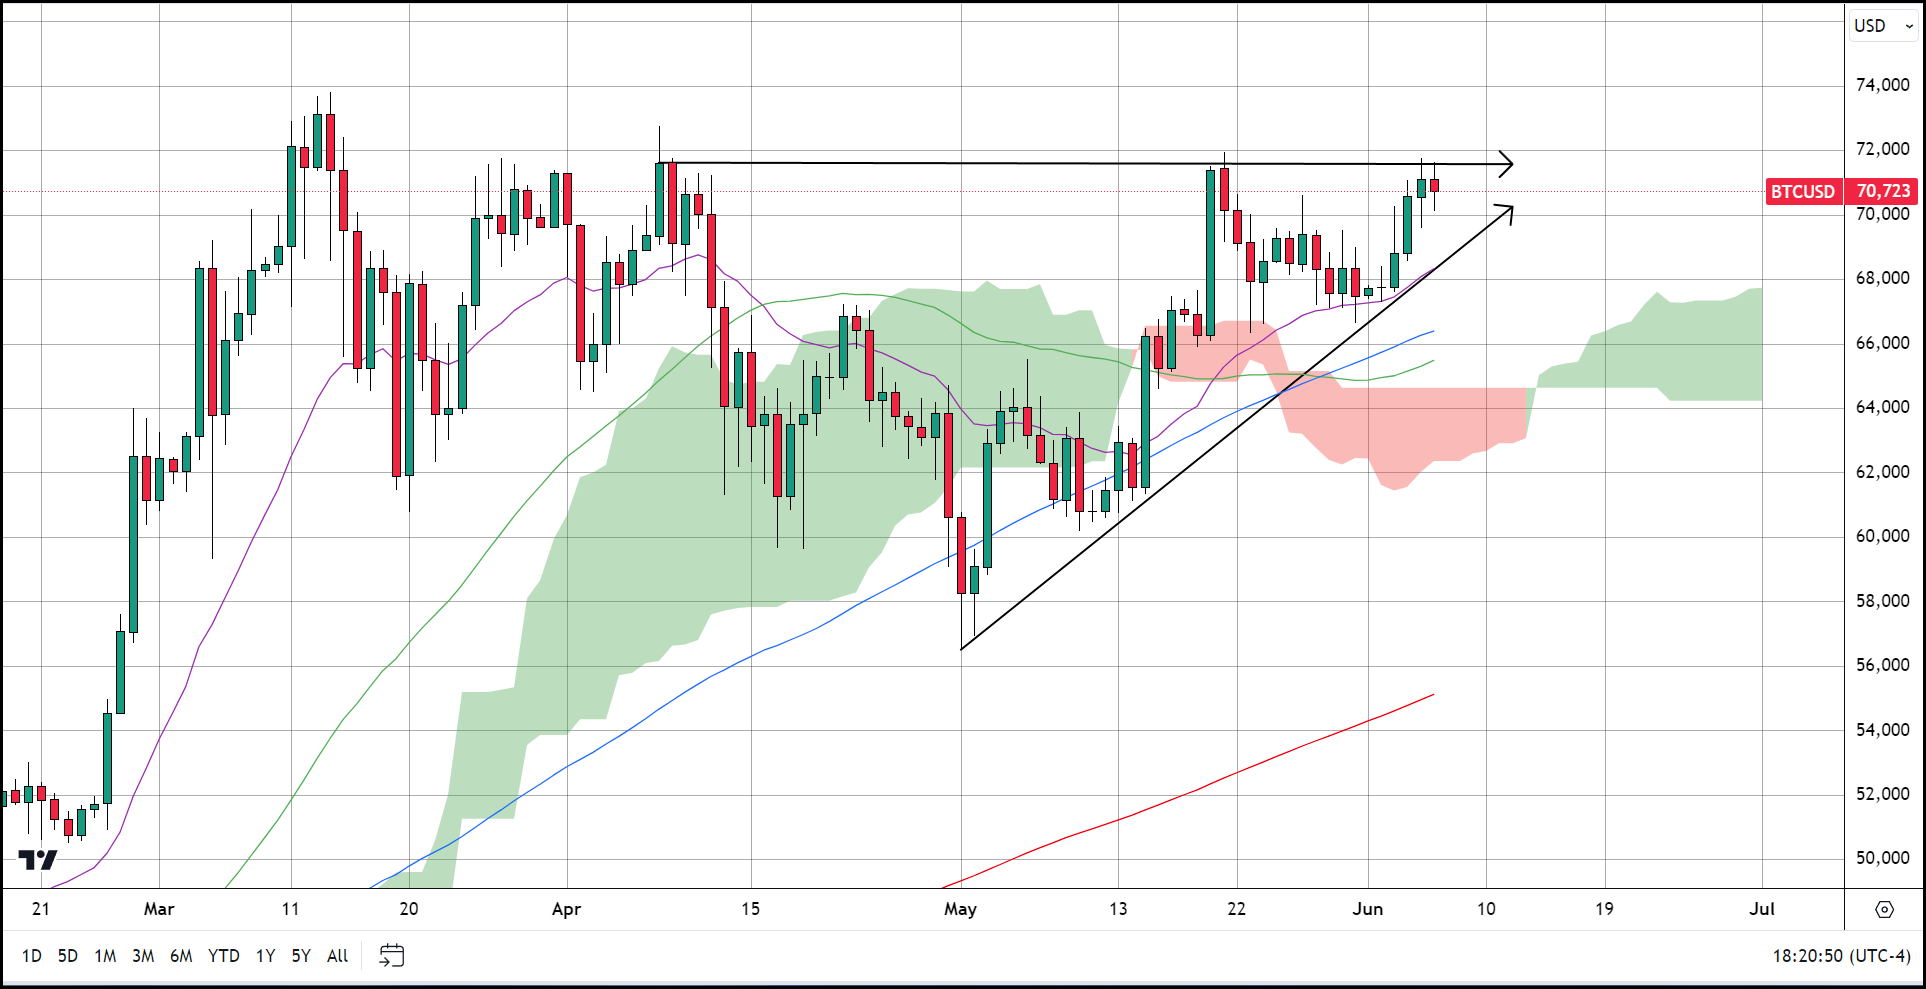
Ascending triangles also referred to as a "flat top rising bottom" are considered a continuation pattern, as the price will typically break out of the triangle in the predominant direction witnessed prior to the triangle. The standard way to utilize this pattern for a trade is to enter a position after a breakout of the triangle. Targets for exiting a trade on these premises are determined by taking the distance at the triangle's widest part and adding or subtracting that length to the breakout point. Protective stops would be placed on the inside of the triangle just below what was once resistance or support.
For Bitcoin's current ascending triangle, a breakout above $72,000 could present us with a move toward the $85,000 level in the near-term, based on this method of measuring the pattern's target.
While a breakout in either direction deserves your attention in the case of BTC’s current triangle, an upside breakout would be considered more tradable as it would represent a continuation of Bitcoins recent upside trajectory overall.
We will be watching the markets closely over the next couple of days and be ready to make a trade recommendation based upon the criteria outlined above.