After The Show - Candle Patterns II

Video section is only available for
PREMIUM MEMBERS
Inverted Hammer & Hammer

 The Inverted Hammer and Shooting Star patterns are part of a larger group of candlestick patterns called the Umbrella Lines. The Umbrella line candles include the Inverted Hammer, the Hammer, the Shooting Star and the Hangman. This pattern group can form in
either color (black or white). This pattern group is one of the only pattern types that is irrelevant of candle color. The other pattern types that share these conditions are the Doji pattern group and the Doji Star pattern group.
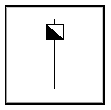
The Inverted Hammer and Shooting Star patterns are the exact same candle formation. What makes this type of candle an Inverted Hammer is when this candle forms after a market down trend. Then it is said that the market is attempting to hammer out a bottom (like the Japanese did to create their copper woks). Confirmation of the Inverted Hammer pattern will generate a buy signal.
When this type of candle is found after an uptrend, it is considered a Shooting Star because of it resemblance of a shooting star in the night sky. Confirmation of the Shooting Star pattern will generate a sell signal.
Notice: Investors should continually watch for Dojis and the Umbrella group of candles. These candle types will typically precede a major market reversal. In fact, many investors have told me these types of candles are some of the most important candle types for investors to use.
Three Gaps
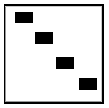
 The Three Gaps pattern is an exhaustion pattern after, in some cases, and extended move. The image shown here is an "ideal" type of illustration. Four black candles with gaps between the range of the candles. Another form would be when you have an extended downtrend (5~100+ bars in a defined down-trend) and you can identify three unique gaps in price action. It does not matter how many bars are inbetween the gaps. All that matters is there are three gaps in a defined trend.
Now, when this happens, you should look for exhaustion of the trend and potential buy/reversal signals. This pattern shows the bearish trend should end soon, thus you need to start looking to the best bullish trend reversals.
If this pattern is found after a nice long extended down trend, then I suggest letting the last price wave settle before trying to "buy right in". Sometimes, the last price wave moves quite a bit after the third gap. It may continue down another 1~3+% before it stops.
This pattern is a setup for an eventual bullish reversal. It is good to use this as a warning that some bullish move should happen in the future - just time it with the other candlesticks and the longer-term charts.
Hanging Man
 The Hangman patterns are part of a larger group of candlestick patterns called the Umbrella Lines. The Umbrella line candles include the Inverted Hammer, the Hammer, the Shooting Star and the Hangman. This pattern group can form in either color (black or white). This pattern group is one of the only pattern types that is irrelevant of candle color. The other pattern types that shares these conditions are the Doji pattern group and the Doji Star pattern group.
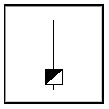
The Hammer and Hangman patterns are the exact same candle formation. What makes this type of candle an Hammer is when this candle forms after a market down trend. Then it is said that the market is attempting to hammer out a bottom (like the Japanese did to create their copper woks). Confirmation of the Hammer pattern will generate a buy signal.
When this type of candle is found after an uptrend, it is considered a Hangman because of it resemblance of a man that has been hung from a rope. Confirmation of the Hangman pattern will generate a sell signal.
Shooting Star
 The Shooting Star patterns are part of a larger group of candlestick patterns called the Umbrella Lines. The Umbrella line candles include the Inverted Hammer, the Hammer, the Shooting Star and the Hangman. This pattern group can form in either color (black or white). This pattern group is one of the only pattern types that is irrelevant of candle color. The other pattern types that share these conditions are the Doji pattern group and the Doji Star pattern group.
The Inverted Hammer and Shooting Star patterns are the exact same candle formation. What makes this type of candle an Inverted Hammer is when this candle forms after a market down trend. Then it is said that the market is attempting to hammer out a bottom (like the Japanese did to create their copper woks). Confirmation of the Inverted Hammer pattern will generate a buy signal.
When this type of candle is found after an uptrend, it is considered a Shooting Star because of it resemblance of a shooting star in the night sky. Confirmation of the Shooting Star pattern will generate a sell signal.
Notice: Investors should continually watch for Dojis and the Umbrella group of candles. These candle types will typically precede a major market reversal. In fact, many investors have told me these types of candles are some of the most important candle types for investors to use.
Three Gaps Pattern
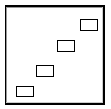
 The Three Gaps pattern is an exhaustion pattern after, in some cases, and extended move. The image shown here is an "ideal" type of illustration. Four white candles with gaps between the range of the candles. Another form would be when you have an extended uptrend (5~100+ bars in a defined uptrend) and you can identify three unique gaps in price action. It does not matter how many bars are in between the gaps. All that matters is there are three gaps in a defined trend.
Now, when this happens, you should look for exhaustion of the trend and potential sell/reversal signals. This pattern shows the bullish trend should end soon, thus you need to start looking to the best bearish trend reversals.
If this pattern is found after a nice long extended uptrend, then I suggest letting the last price wave settle before trying to "sell right in". Sometimes, the last price wave moves quite a bit after the third gap. It may continue up another 1~3+% before it stops.
This pattern is a setup for an eventual bearish reversal. It is good to use this as a warning that some bearish move should happen in the future - just time it with the other candlesticks and the longer-term charts.

Gary S. Wagner - Executive Producer