Dollar Strength resulting from higher Treasury yields pressures gold lower

Video section is only available for
PREMIUM MEMBERS
Higher yields in the U.S. Treasury notes were a primary factor taking the U.S. dollar higher, which in turn pressured gold to close lower on the day. This is the first instance in which gold has closed lower in the last eight consecutive trading days.
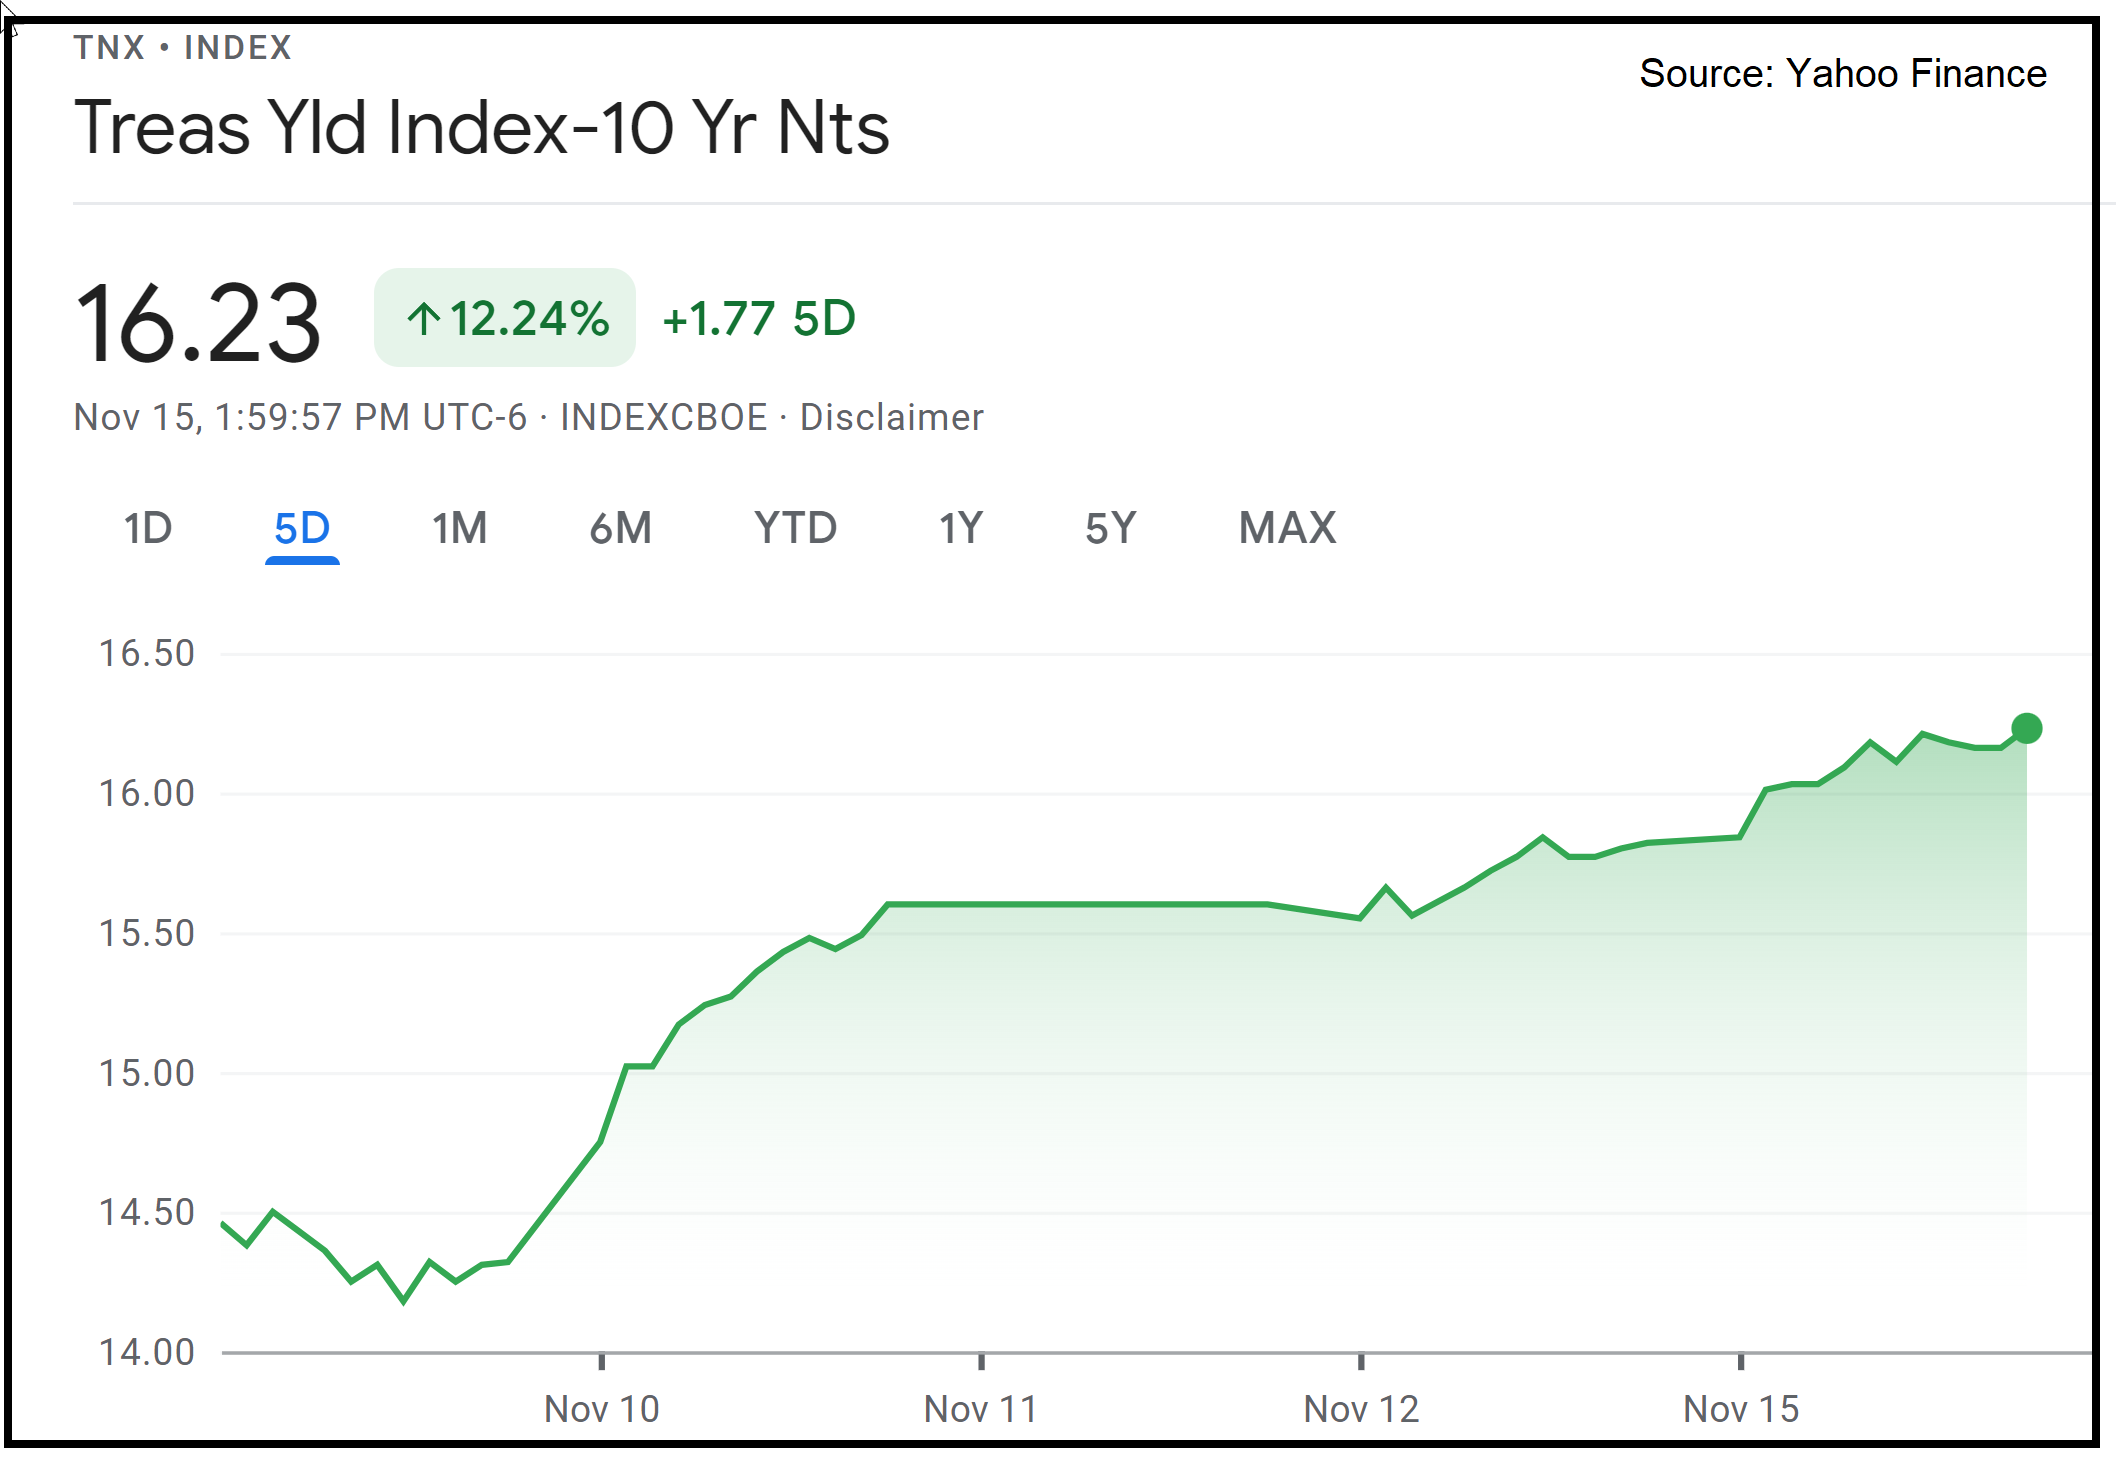
10-year Treasury notes started the week with a solid gain of 0.041 basis points, a net gain of 2.59%, with the current yield up and fixed at 1.623%.

According to CNBC, U.S. “Treasury yields climbed higher Monday as investors continued to digest data from the previous session, which showed workers quitting their jobs in record numbers. The yield on the benchmark 10-year Treasury note rose by 4.1 basis point to 1.625% at 4:05 PM EST. The yield on the 30-year Treasury bond added 5.9 basis points, rising to 2.014%. Yields move inversely to prices, and one basis point is equal to 0.01%.”
Concurrently higher yields led to a higher U.S. dollar, with the dollar index hitting a 16-month high. The dollar gained 0.38%, or 36 points, and is currently fixed at 95.49. The last occurrence of the dollar trading this high was on July 20, 2020. At that time the dollar had been on a steep decline beginning at the end of June 2020 when the dollar traded to just below 98.00.
As of 5:40 PM EST gold futures basis, the most active December contract is currently fixed at $1864.70, which is a net decline of $3.80, or 0.20%. Because gold is paired against the dollar, and gains in the dollar were roughly double the decline of gold prices, clearly today’s decline in gold was predominantly based upon dollar strength rather than selling pressure from market participants.
Gold continues to be favored as an inflationary hedge as a safe-haven asset, an asset class that is still solidly in a bullish trend. However, the last four trading days have hit a resistance area that has not been effectively taken out. The resistance area is based upon the 78% Fibonacci retracement which occurs at $1867.50. The data set used to create the Fibonacci retracement begins at $1920, the highest trading value reached during the beginning of June 2021, and concludes at $1678, the low of the flash crash that occurred in August of this year. That low also corresponds to the double bottom that occurred in March 2021, which strengthens that price point because historically it has acted as solid support on three instances this year.
While the Federal Reserve has begun the process of tapering its monthly asset purchases of $120 billion this month, the Fed has made it emphatically clear that it will not begin to raise interest rates this year or the first half of 2022. There is mixed market sentiment by Federal Reserve voting members as to when the Federal Reserve will begin to normalize interest rates (lift-off). On Sunday the president of the Minneapolis Federal Reserve Bank said that he expects inflation to move higher over the next few months. However, he suggested that the central banks should not overreact or react too quickly to this elevated level of inflation because he believes that the current rate of spiraling inflation is transitory. More hawkish members of the Federal Reserve are suggesting a total of two interest rate hikes at the end of next year.
As we have seen gold move close to $1900 in the last two weeks our best hope for this rally to continue would be to see sideways trading action with gold consolidating at this new price level and then move higher. The worst-case scenario would be a defined correction giving back a percentage of the recent gains. On November 24, the government will release its latest data on the PCE inflationary index and depending on the outcome, that number could have a profound effect on gold pricing.
Wishing you, as always, good trading and good health,

Gary S. Wagner - Executive Producer