Gold trades to a critical price support level this week

Video section is only available for
PREMIUM MEMBERS
Gold prices ended the week with little change on the day, and little change when compared to last Friday’s close. Gold futures basis the most active December 2021 contract is currently fixed at $1750.60, which is a net gain of $0.80 (+0.05%) on the day. Gold futures did trade with a lower high and a higher low when compared to yesterday’s trading range. The largest decline occurred yesterday, a delayed reaction to Wednesday's conclusion of this month’s FOMC meeting.
The fundamental event that pressured gold dramatically lower yesterday was the release of the FOMC meeting statement and Chairman Powell’s press conference. In terms of when the Federal Reserve will begin to taper, the statement acknowledged that tapering will begin “soon”. It is now believed that an announcement as to when the Federal Reserve will begin the process of tapering their monthly asset purchases will be in November. It is also widely believed that tapering could begin as early as December.
However, the news that startled market participants and gold investors was the newly revised “dot plot”, which shows the projections of interest rate normalization. The most recent projections revealed that there could be an interest rate hike next year rather than 2023. The Federal Reserve has made it emphatically clear that their timeline to begin tapering, and their timeline to initiate lift-off of interest rate normalization have different criteria.
The Federal Reserve also acknowledged that inflationary pressures will probably be sustained for a longer period than the most recently projected. The Fed has been focusing on maximum employment rather than inflationary pressures, both of which compose their primary dual mandate. Inflationary pressures continued to mount as indicated by the release this month of the August CPI. It indicated an increase of 0.3% from July to August. The report from the Bureau of Labor Statistics also indicated that inflation has risen to 5.3% for the 12 months ending in August 2021.
“The Consumer Price Index for All Urban Consumers (CPI-U) increased 0.3 percent in August on a seasonally adjusted basis after rising 0.5 percent in July, the U.S. Bureau of Labor Statistics reported today. Over the last 12 months, the all items index increased 5.3 percent before seasonal adjustment.”
It is this report that is most likely the underlying rationale for the Federal Reserve moving up their timeline for liftoff when they will raise interest rates for the first time since the onset of the pandemic over 20 months ago.
Gold's strong bearish reaction to the potential for interest rates rising quicker than the Federal Reserve had projected previously. This is because higher interest rates intrinsically increase the opportunity of holding gold which yields no interest gains to the investor.

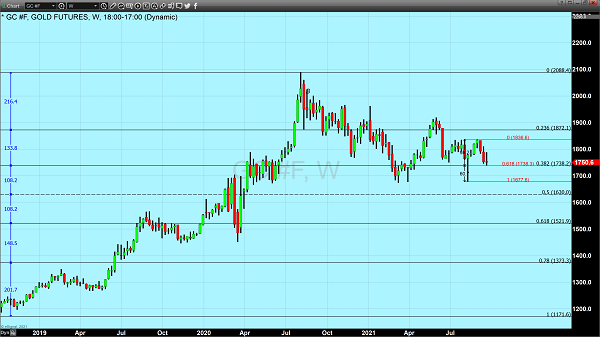
Gold is currently very susceptible to lower pricing and on a technical basis is at a key and critical level. Our technical studies indicate a Fibonacci harmonic’s between two data sets, one created from daily charts, and the other created from weekly charts.
The longest data set begins in October 2018 when gold was trading at $1171, up to the current record high achieved in August of last year when gold reached an apex of $2088. Currently, gold’s low this week matched the 38.2% Fibonacci retracement of this long data set. It also matched the 61.8% Fibonacci retracement which was created from a daily chart. A Fibonacci harmonic’s occurs when two different data sets have the same price point for one of the key Fibonacci numbers. This makes that price point a much more critical level on a technical basis.
Wishing you, as always, good trading and good health,

Gary S. Wagner - Executive Producer