Death cross averted in gold and technical studies indicate a possible bottom

Video section is only available for
PREMIUM MEMBERS
On Friday my article spoke about the fact that it seems as though a pattern called a “Death Cross” was imminent. I said this because the difference between the 50- and 200-day moving averages was only $0.20. The short-term 50-day moving average was fixed at $1805.70, and the 200-day moving average was fixed at $1805.50. That critical difference grew much wider today as gold prices gained approximately $11. As of 6:10 PM EST, the most active April 2022 Comex contract is currently fixed at $1798.70 as it is currently trading up by $2.30 overseas.

Today’s gains in gold were directly attributable to dollar weakness. The dollar index lost 0.63% and is currently fixed at 96.65. Trading in New York resulted in gold gaining 0.62%, gold’s gain today was almost the exact percentage that the dollar declined which meant that neither the bullish or bearish faction was able to move pricing in any direction.
Now that the cat’s out of the bag so to speak with the announcement last week by the Federal Reserve that March will be the month that they initiate interest rate normalization with the first of multiple rate hikes. Analysts now have various projections on how many rate hikes the Fed will implement this year and the real possibility that the rate hikes might be more than ¼% each as defined by the Federal Reserve.
However, it is inflation that is on the minds of market participants with Friday’s report showing the PCE index (the preferred inflation index used by the Federal Reserve) to move to a 40 year high just like the CPI index did last month. Currently, the PCE index which strips out food and energy costs has risen by 5.8%, almost 3 times the Federal Reserve’s inflation target rate of 2%.
Because inflationary pressures could have a profound impact on the dollar and gold, the lows on Friday could have been the conclusion of the most recent correction.
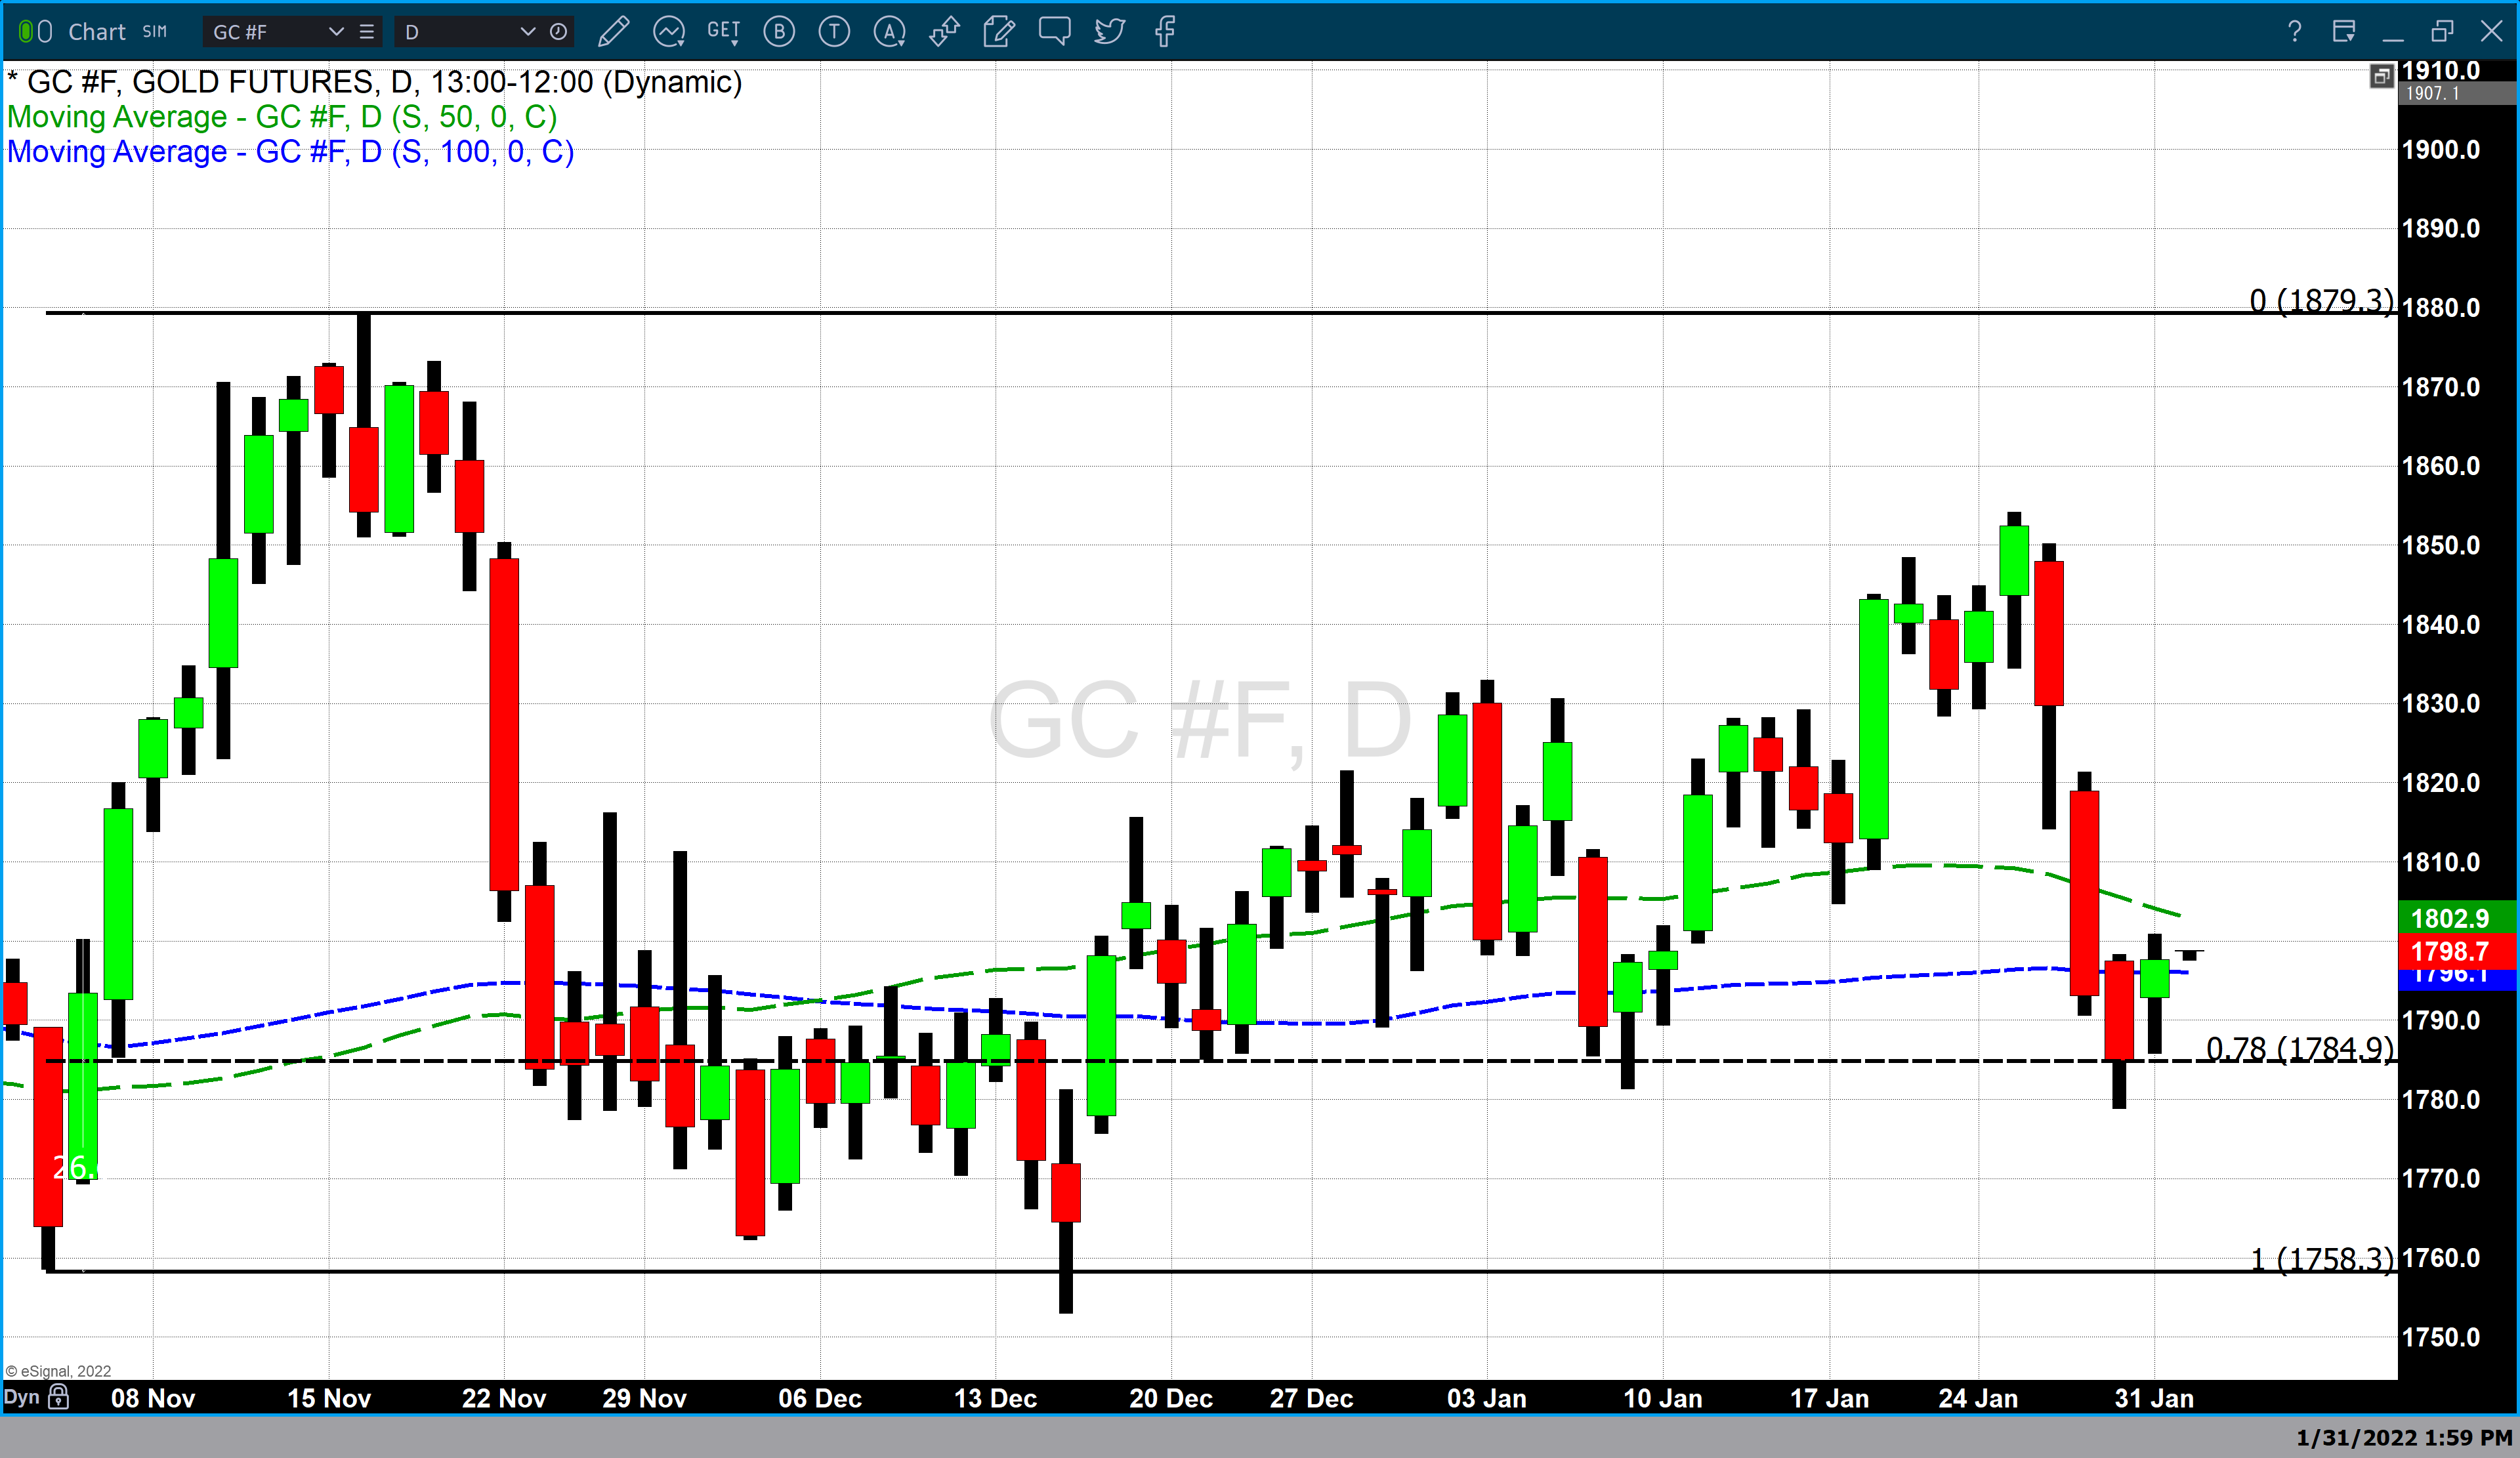
In our video report on Friday, we spoke about the importance of where gold prices closed which was at a 78% retracement from the November rally. Chart 1 is a daily candlestick chart of gold futures with a Fibonacci retracement which begins on November 3 ($1758) to November 16 ($1879). On Friday gold traded below the 78% retracement however, it closed precisely at $1784.90. A 78% retracement is a deep but acceptable retracement level following a strong rally. It was for that reason that we spoke about the fact that this is a very strong area in which gold could find price support. That is exactly what we saw today with gold opening at $1792 and closing at $1797.70.

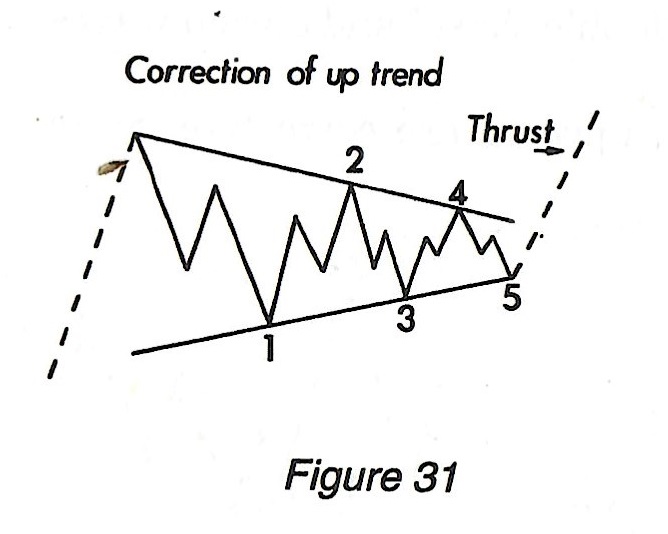
Chart 2 is a reprint from RN Elliott’s Masterworks labeled figure 31 found on page 234. According to Elliott wave principles, one type of corrective pattern is simply labeled as a triangle. According to his book titled R.N Elliott’s Masterworks, “triangles are composed of five waves, or better said five legs. In the larger types, each leg will be composed of three waves.” This type of pattern can identify a correction wave in both an uptrend and a downtrend. The example presented above is a correction wave of an uptrend.

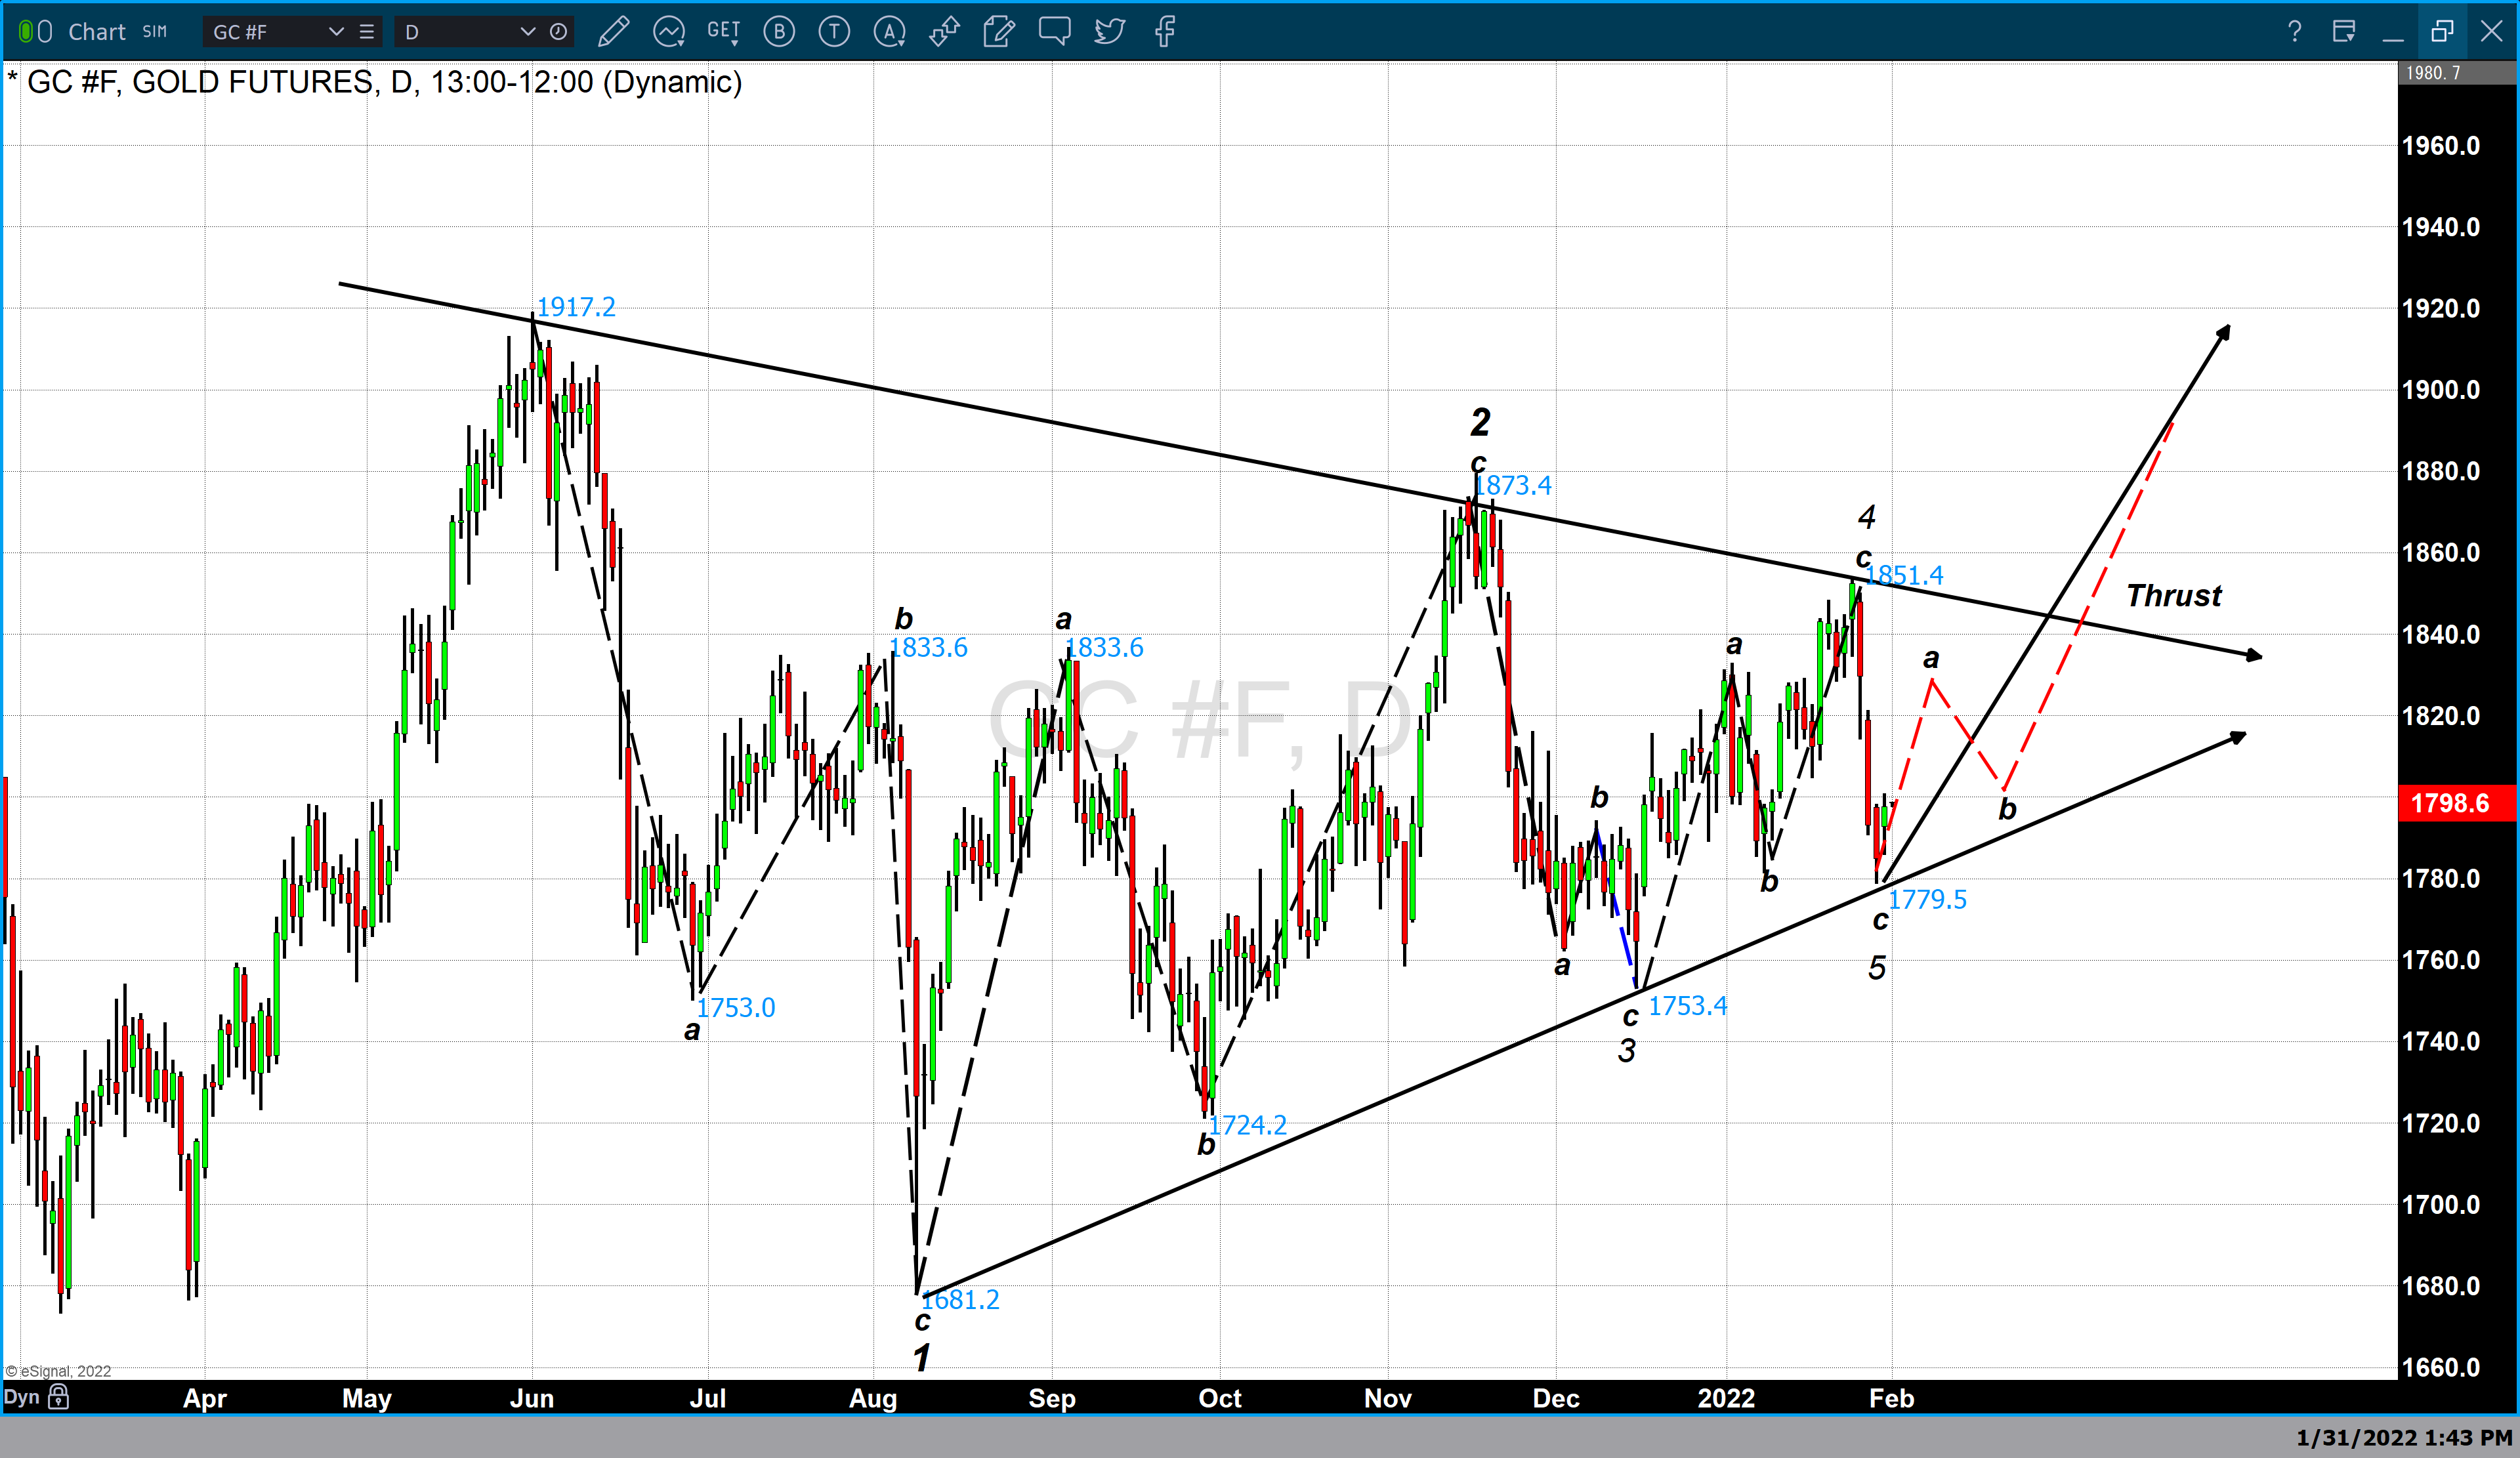
Chart number three is also a daily candlestick chart of gold which contains a model based upon a correction pattern identified by R.N Elliott which we identified in the current price structure of gold. This triangle was created because beginning in June 2021 gold hit a high of $1917 and then traded to a low of $1681 in August. What followed was a series of lower highs and higher lows which continue up until today. The chart contains five waves or legs beginning at $1917 with the first wave concluding at $1681. While this is only one possible outcome of this type of compression triangle it certainly warrants our consideration. Drawn as red lines are the projections that are based on the assumption that Friday’s low was the conclusion of the corrective 5th wave. The projection in red is not meant to indicate either the high that gold could reach or where pricing will occur during the sub-waves (a, b, and c)
Wishing you as always good trading and good health,

Gary S. Wagner - Executive Producer