Did recent price action in gold create a “Cup and Handle” Pattern?

Video section is only available for
PREMIUM MEMBERS
One of the comments from yesterday’s “After Hours” article was a question about the identification and validity of a pattern. I felt that the reader was correct in identifying this pattern and warranted an explanation of how to incorporate this pattern into the current price action in gold.
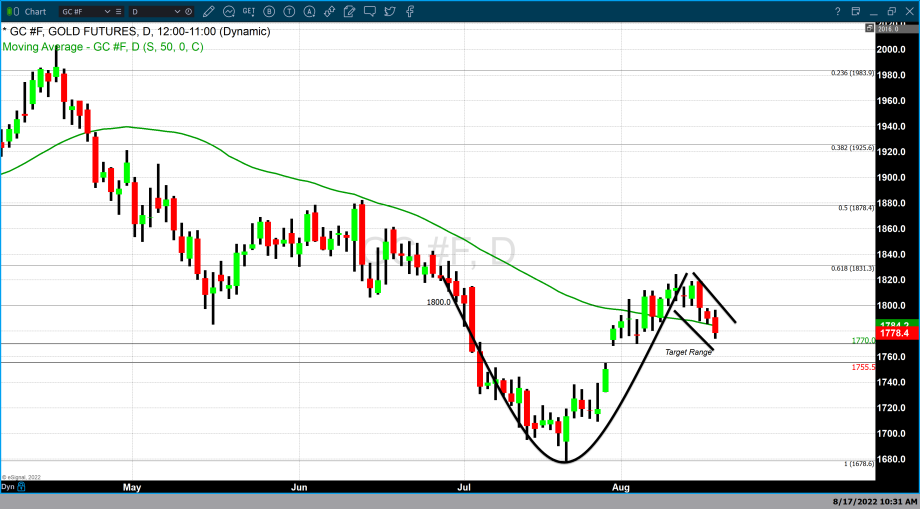
Glen Acres of Seattle Washington asked about a pattern called a “cup and handle”, and if recent price action in gold futures has resulted in the formation of this pattern. First and foremost, I agree with Glenn in his identification that the rounded bottom in gold followed by a period of consolidation with a downward biased can be correctly labeled as a “cup and handle” pattern.
This pattern was created by William O’Neill who founded a stock brokerage company firm before launching the business newspaper, “Investor’s Business Daily” in 1984. He is the author of, “How to Make Money in Stocks”, 24 essential lessons for investment success. It was in this publication he first revealed his pattern.
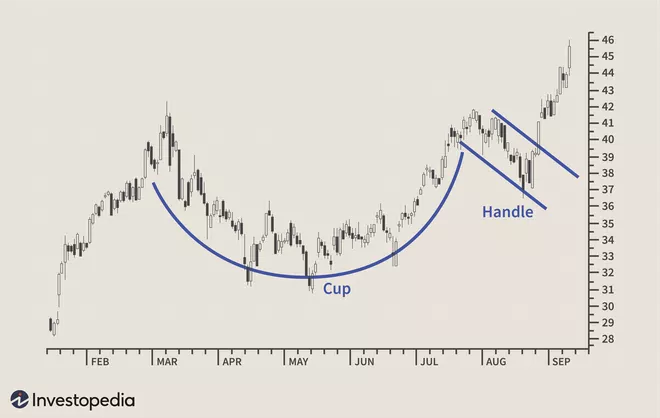
William O’Neill’s “Cup with Handle” pattern is a bullish continuation pattern. This pattern identifies a period of consolidation which is the precursor to a breakout to the upside. The pattern is composed of two parts: the cup and the handle. The cup is analogous to a Western technical pattern called a “rounded bottom” as it resembles a bowl.
This is followed by the “Handle”. This occurs after the rounded bottom is complete and the highs form on the right side which begins to consolidate with a bias to the downside creating a pattern that resembles a flag or pennant formation.
How to use a “Cup and Handle” pattern
As the handle forms, you wait at some point the pennant formation with a downside biased will begin to start moving higher. Once rising prices are above the top of the cup it signals a valid buy signal. Typically, it is believed that the upside rally will and once price action has gone above the top of the cup equal to the distance between the bottom and top of the cup.
The chart above is a daily gold chart in which we have drawn the “cup and handle”. I hope this answers the question posed by one of our readers.
Wishing you as always good trading,

Gary S. Wagner - Executive Producer


