The Feds hawkish demeanor with intent to dramatically raise rates pressure gold lower

Video section is only available for
PREMIUM MEMBERS
This week market participants seemed complacent in regards to the Russian invasion of Ukraine, and the current level of inflation. Four of the five trading days this week were characterized as having lower closes than its opening daily price as well as lower closes compared to the prior day closing price.
On Wednesday when the Federal Reserve concluded its FOMC meeting gold hit its lowest value with the April futures contract trading to a low of $1895. Although gold recovered from low its closing price was the lowest value of closes this week. Thursday was the only day in which gold closed above its open and above the prior days closing price.
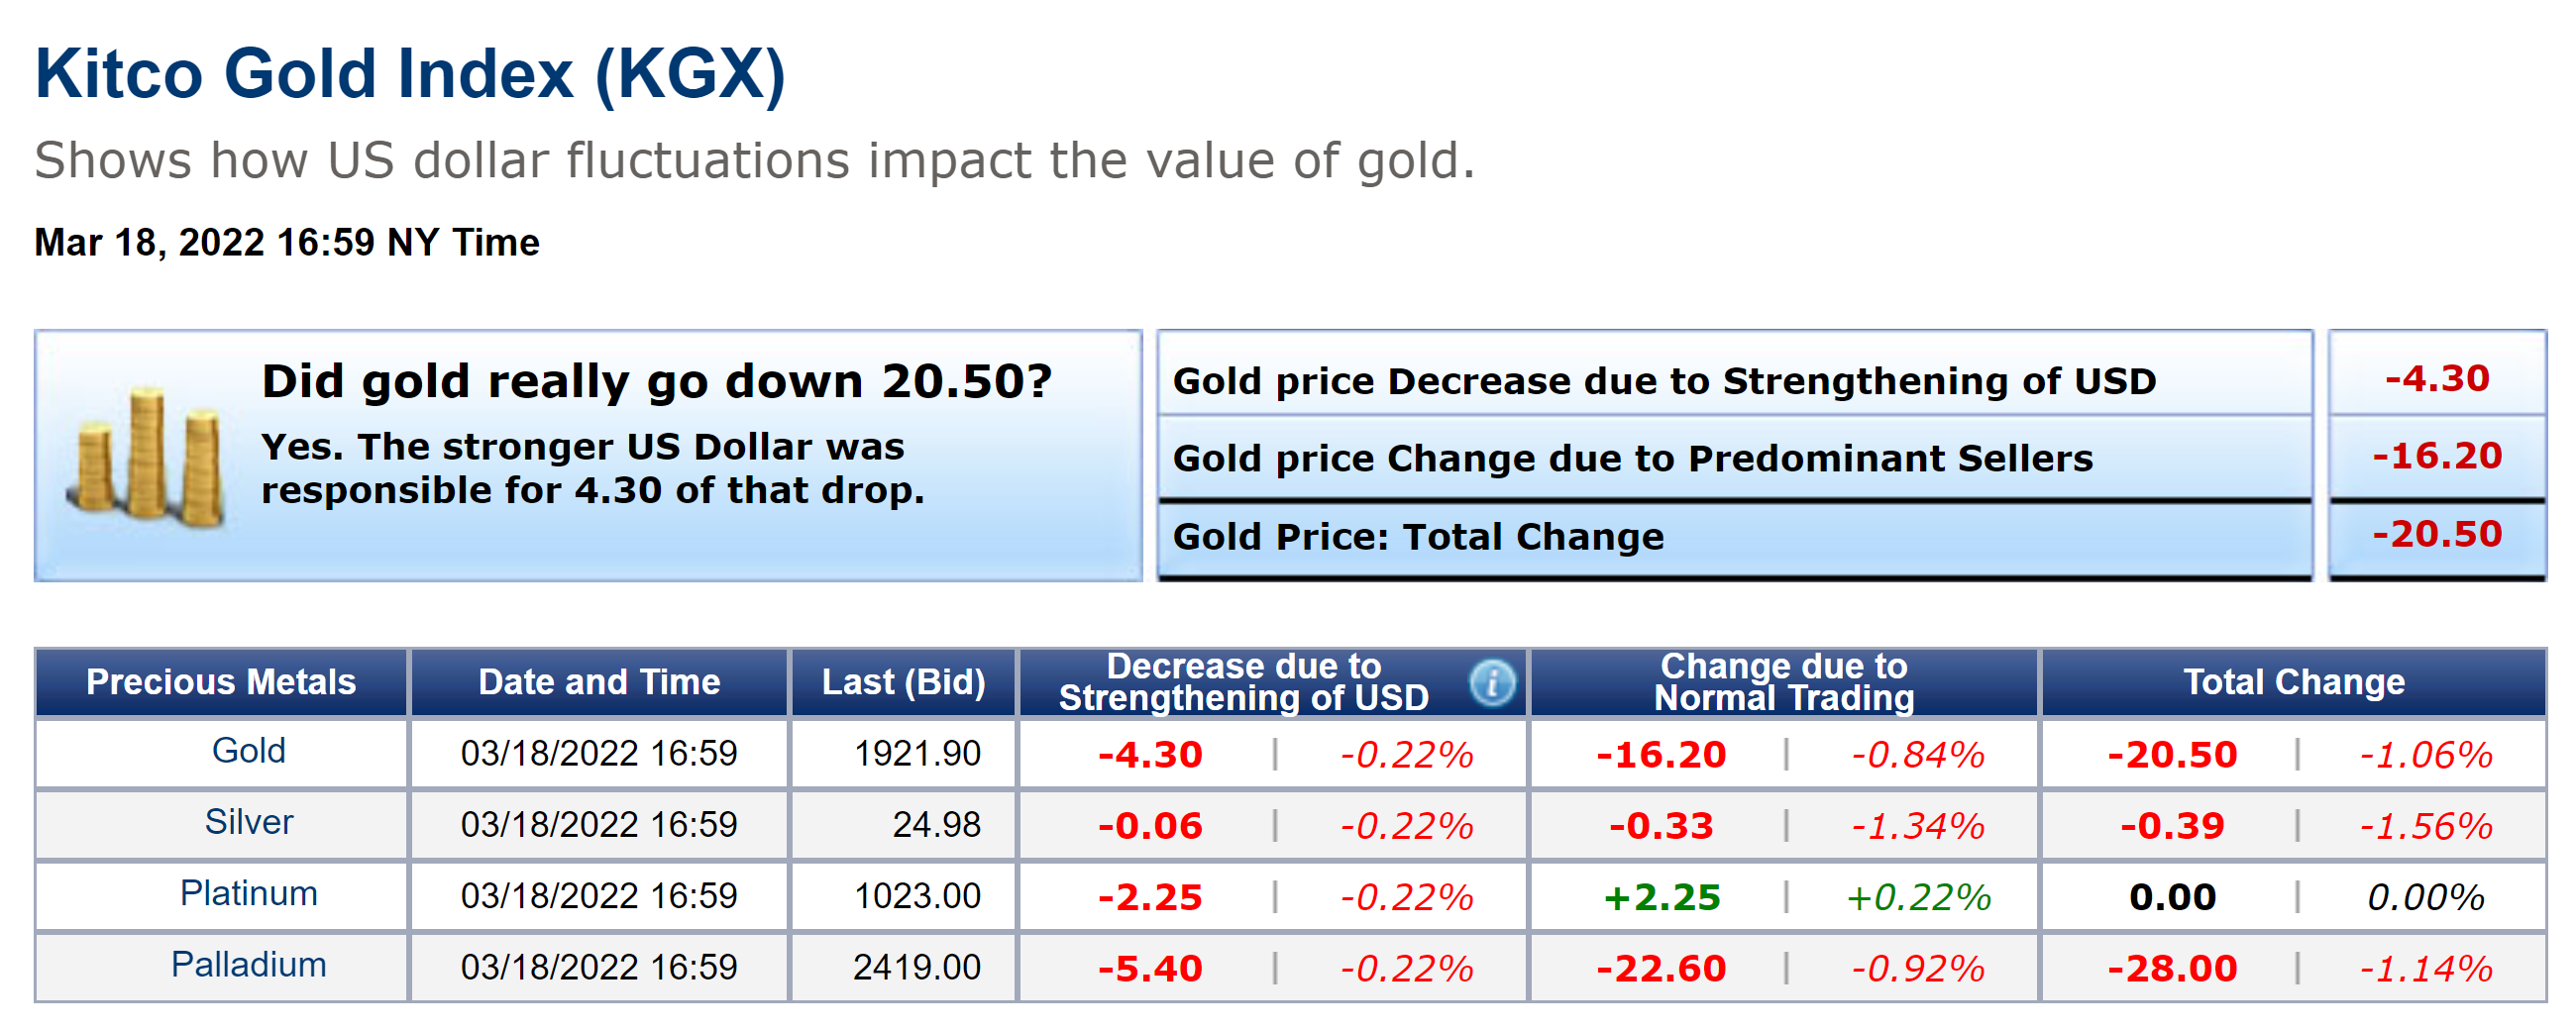
Gold futures basis most active April 2022 Comex contract declined by $21.70 or 1.12% and is currently fixed at $1921.50. Today’s decline was a result of modest dollar strength in strong selling pressure. Spot gold is currently fixed at $1921.90 closing $20.50 lower on the day. According to the KGX (Kitco Gold Index) today’s decline was a result of strong selling pressure resulting in a price decline of $16.20 combined with dollar strength which took gold an additional $4.30 lower.
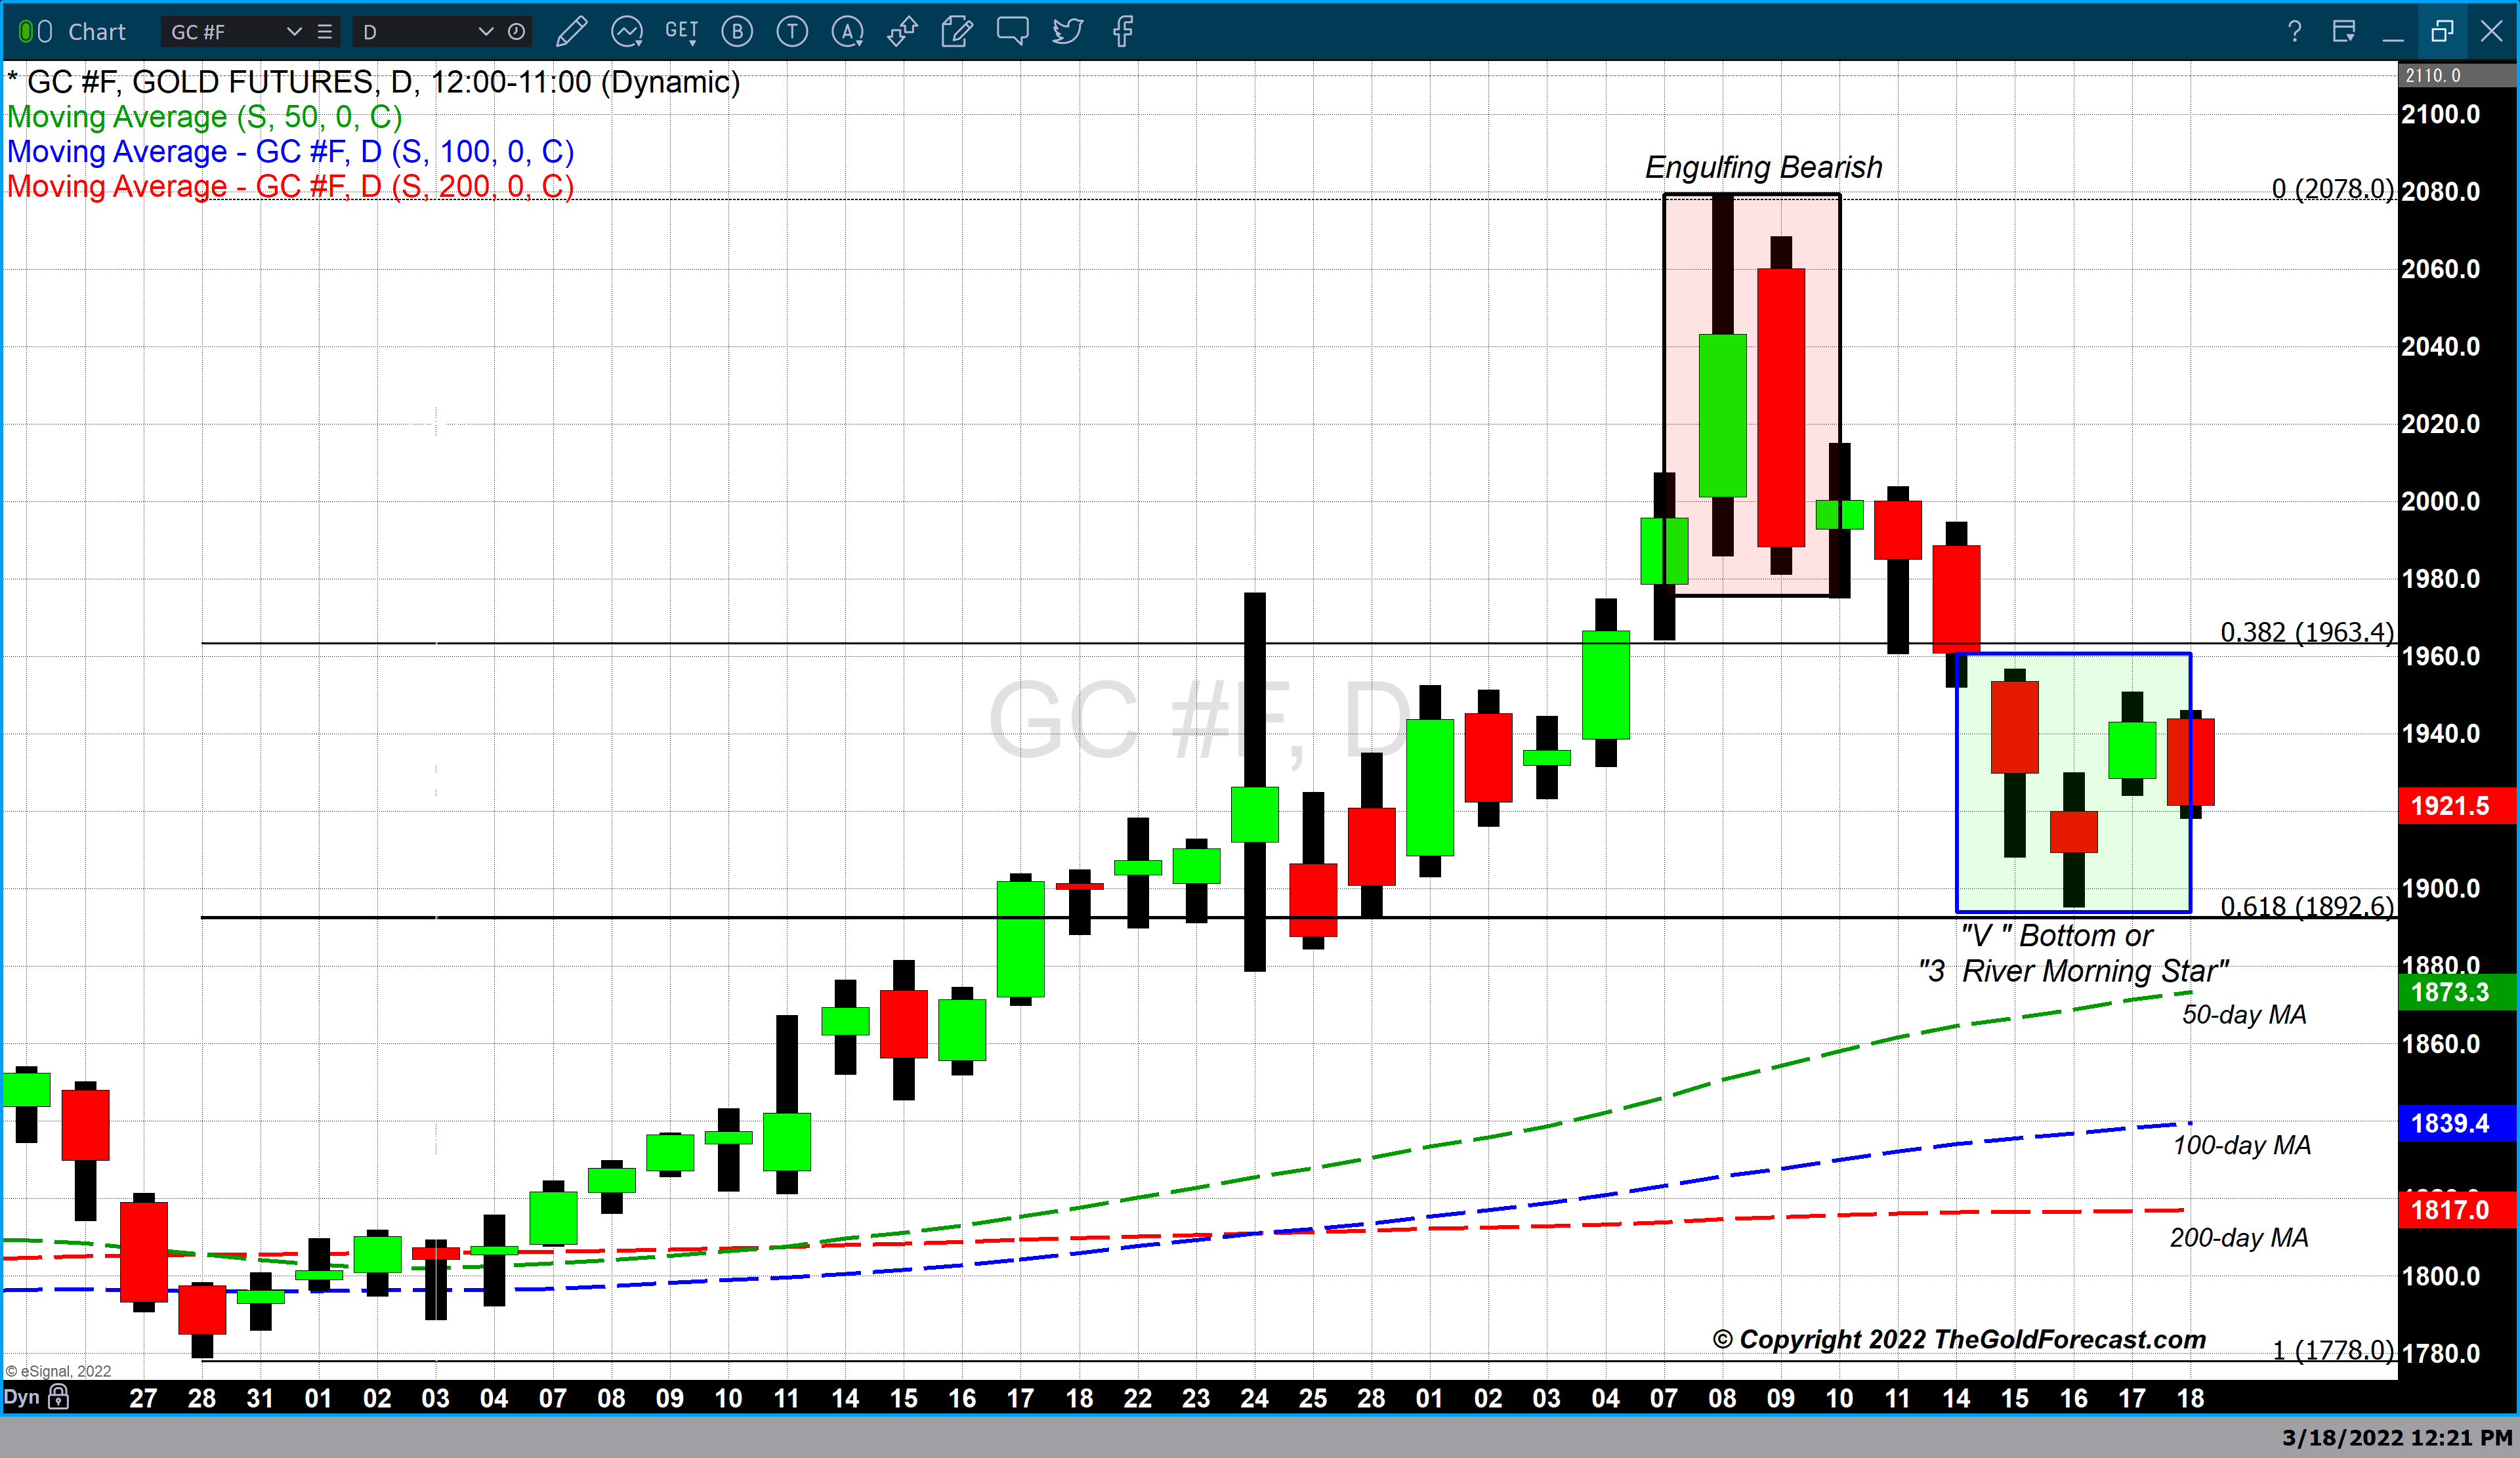
Chart one is a daily candlestick chart of gold beginning at the end of February to today’s closing price. Several chart patterns can be identified. The lows at the end of February marked the beginning of a strong rally. This rally resulted in gold trading to its highest value since August 2020 when on March 8 gold traded to a high of $2078, just $10 below gold’s record high of $2088.
On March 9 gold opened above and closed below the open and closing price of March 8 which created a simple two-day Japanese candlestick pattern called and “Engulfing Bearish” pattern. This Japanese candlestick pattern can indicate a market top followed by a price reversal which results in lower pricing. This pattern is created after a defined uptrend. The first candle in the pattern is a green candle which trades to a new price high of the rally, followed by a long red candle. The red candle completely engulfs the body of the prior green candle. This pattern correctly predicted a market top which took gold from $2078 to this Wednesday’s low at $1895.
The price decline in gold resulted in Wednesday’s low of $1895 and was followed by a sharp price increase on Thursday. Western market technicians identify this price action as a “V” bottom. The pattern as its name suggests is a “V” shaped channel that is created during a correction that has potentially completed. The analogous Japanese candlestick pattern to a “V” bottom is called a “3 River Morning Star”.
Wishing you as always good trading,

Gary S. Wagner - Executive Producer