Gold barely holds above $1800 as investors wonder about the Fed's next rate hike

Video section is only available for
PREMIUM MEMBERS
As of 3:55 Pm EDT gold futures basis, the most active December contract is currently fixed at $1800.90 per ounce after factoring in today’s decline of just over $12 or 0.66%. Unlike other days the dollar is not contributing to the net change of gold. Currently, the dollar index is in essence unchanged up 0.01% and fixed at 105.090.
For the better part of this week, gold futures have been challenging $1800 trading just below this price point and closing just above it. Today gold traded to a low of $1798.60 after opening at $1807.90 and trading to a high of $1814.90. This recent selling pressure is a net result of investors trying to gauge the magnitude of the next rate hike by the Federal Reserve when they convene in September. Currently, it is almost a virtual coin toss according to the CME’s FedWatch tool. The CME’s probability indicator is forecasting that there is a 59.5% probability that the Federal Reserve will raise rates by 50 basis points and a 40.5% probability that the Federal Reserve will raise rates by 75- basis points.
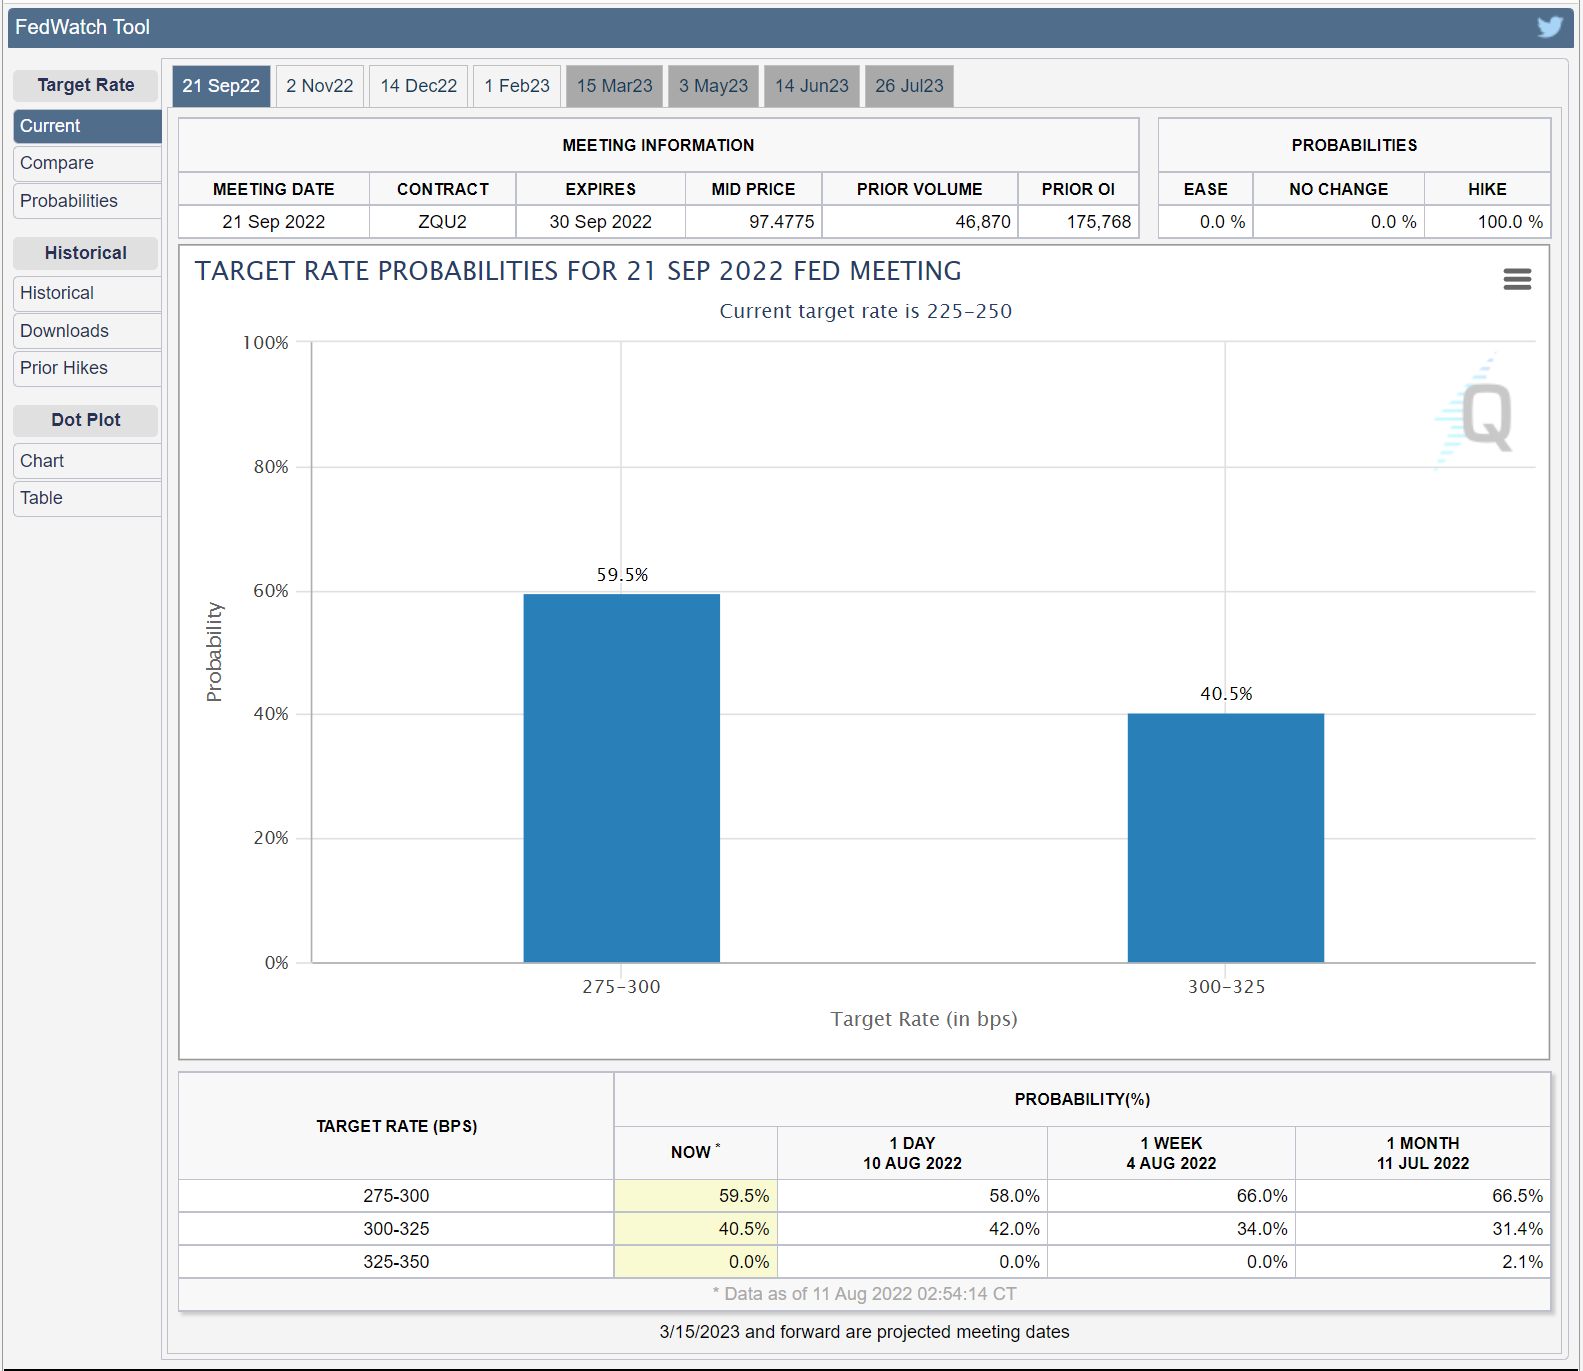
When compared to a month ago this indicator was forecasting a 66.5% probability of a 50-basis point rate hike and only a 31.4% probability that the Fed would issue their third consecutive 75- basis point rate hike at the next FOMC meeting which will begin on September 21 and conclude the following day.
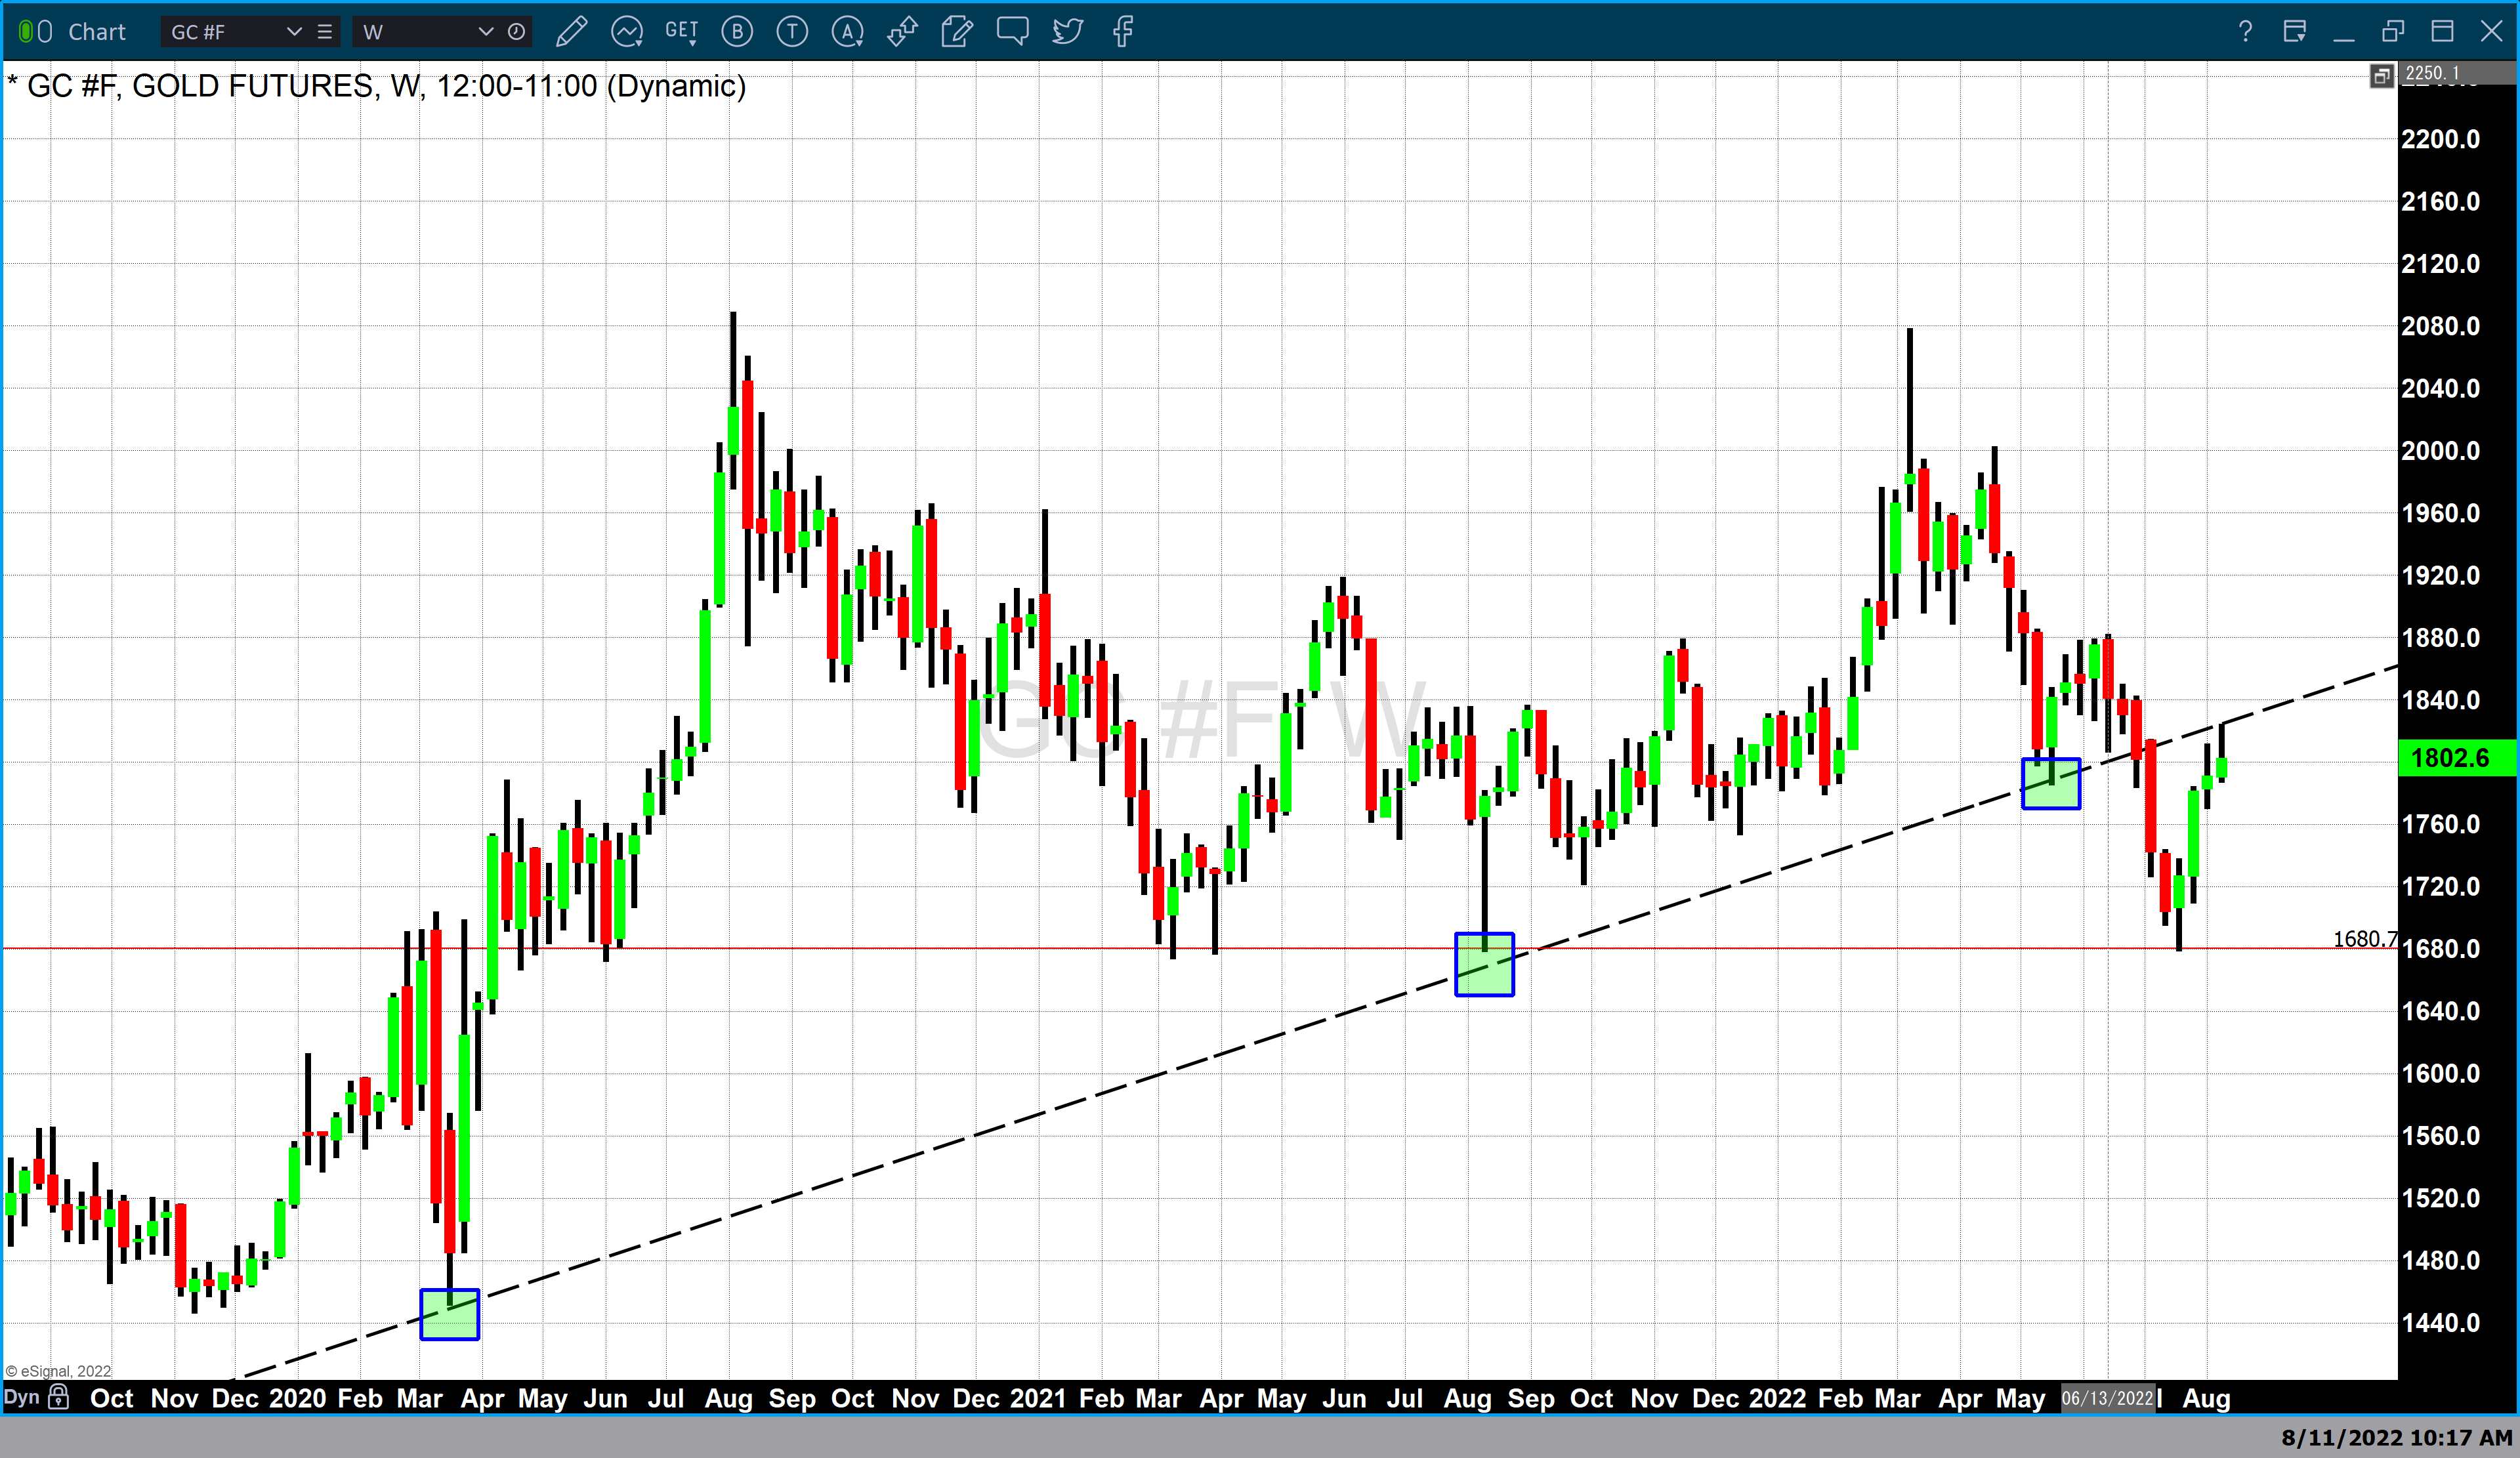
The chart above is a weekly candlestick chart of gold futures with a single support trendline that was created from a series of higher lows. The first higher low occurs during the week of March 16, 2020, when gold was trading at $1450. The second low occurs at $1679 during the week of August 16, 2021, and the final low is fixed from the low that occurred during the week of May 16 at $1792.
During the week of June, 27 gold prices broke below the support line and over the following three weeks plunged to the low of the flash crash at $1680. This was followed by four consecutive weeks in which gold closed higher than the previous week and higher when compared to the opening price on Monday of that week. The most current candle represents trading this week in which gold traded to a high of $1824. This week’s high occurs just below the original support trendline which has become a resistance trendline after gold broke below it during the week of June 27. This indicates that at least on a technical basis gold futures have encountered real resistance at approximately $1825.
That being said, gold remains under pressure trying to hold on to a minor support level at $1800 per ounce. Major support in gold occurs at $1788.70 and is based upon the current value of gold’s 50-day moving average.
Wishing you as always good trading,

Gary S. Wagner - Executive Producer