Gold breaks below $1680 yesterday, closing below a major level of technical support

Video section is only available for
PREMIUM MEMBERS
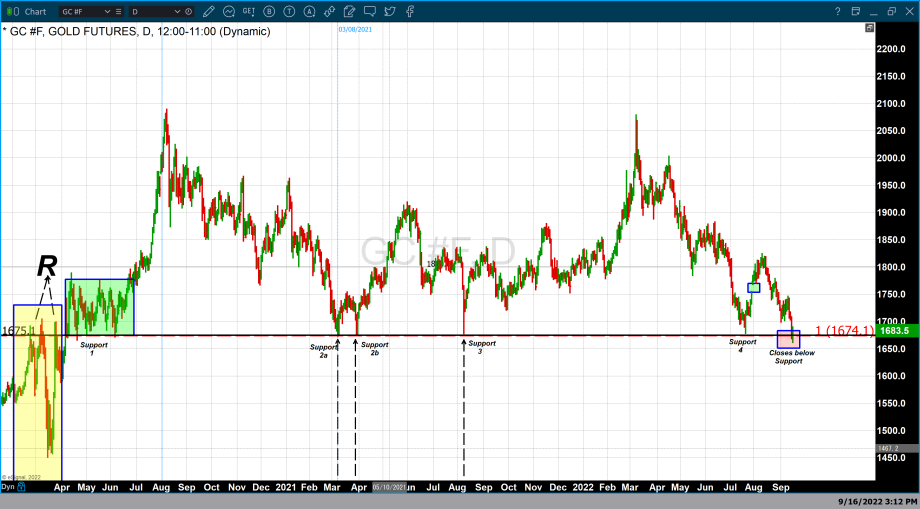
Yesterday gold closed below the support level of $1680 closing at $1674. This was the first instance of a close below $1680 since gold broke above that price point in April 2020. The yellow rectangle on the left-hand side of “chart 1” illustrates the break above that level. It is marked with a large letter” R” on the weekly gold chart below.
Following the break above $1674 that support level was successfully tested on multiple occasions, labeled “support 1” marked with a green rectangle, it occurred between May and July 2020.
What followed were multiple instances when gold traded as low as $1675 and recovered. These areas are marked as support 1, 2a, 2b, and 3. Up until yesterday every attempt to breach and traded below $1675 was unsuccessful. That is what makes yesterday’s price move below that support level so significant on a technical basis.
Traders can view recent action as either an extremely rare opportunity or an utter breakdown and failure for gold to move substantially higher. Recent actions by the Federal Reserve have had the net result of rising yields in U.S. debt instruments and dollar strength. However, the question becomes whether gold will break substantially to lower pricing, or as it has in the past recover and move substantially higher. According to our technical studies, we are looking at a glass half-full and not a glass half-empty. In other words, traders looking to buy the dip will face two obvious outcomes; either exceedingly great success or exceptionally dangerous failure.
I believe that the glass is half-full and as such has tremendous profit potential. However. I must also acknowledge that if this strategy is incorrect, the damage would be enormous.
Wishing you as always good trading and good health,

Gary S. Wagner - Executive Producer
