Gold – Technical Outlook: is $1680 a technical line in the sand for gold?

Video section is only available for
PREMIUM MEMBERS
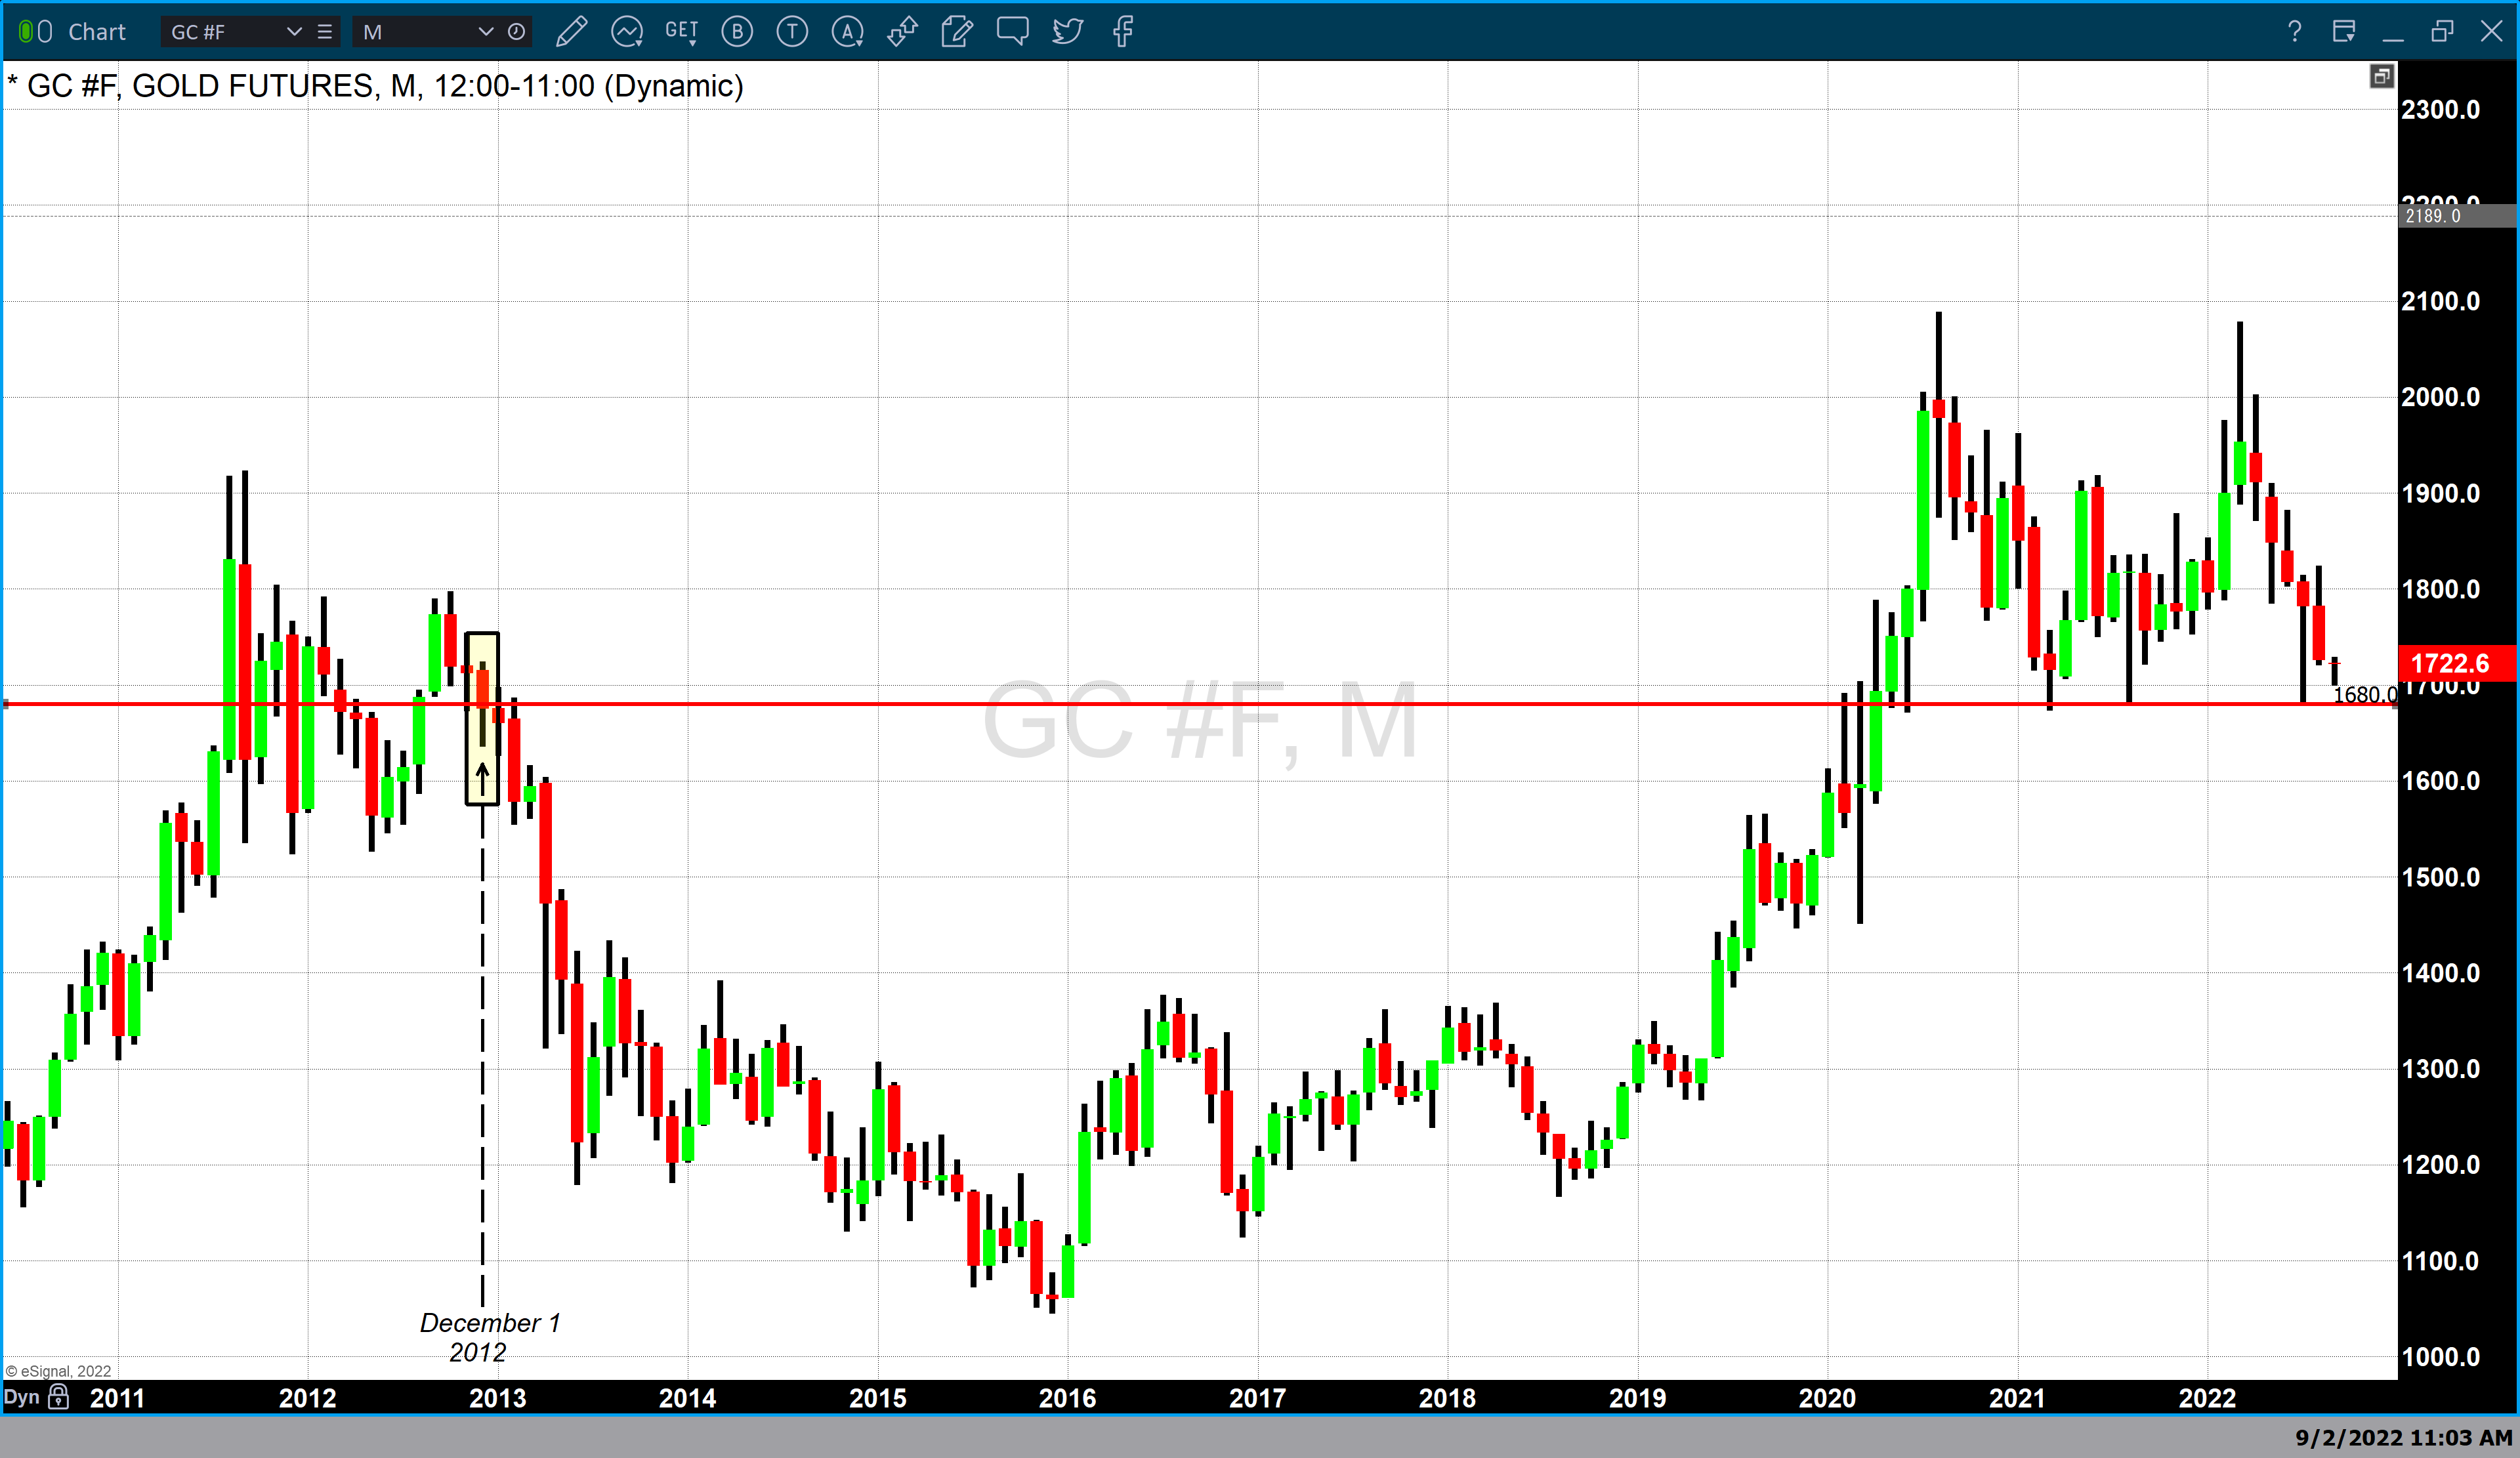
The chart above is a monthly chart of gold futures. The horizontal red line is fixed at $1680 per ounce. In December 2012 gold futures opened at $1770 traded to a low of $1635 and then settled at $1671. This would be the last time that gold was valued above $1700 until April 2020. Gold prices would drift lower until December 2015 when gold hit a low of $1046. This would also mark the beginning of a multiyear rally in which gold moved from approximately $1000 at the beginning of 2016 to its current record high of $2088 in August 2020.
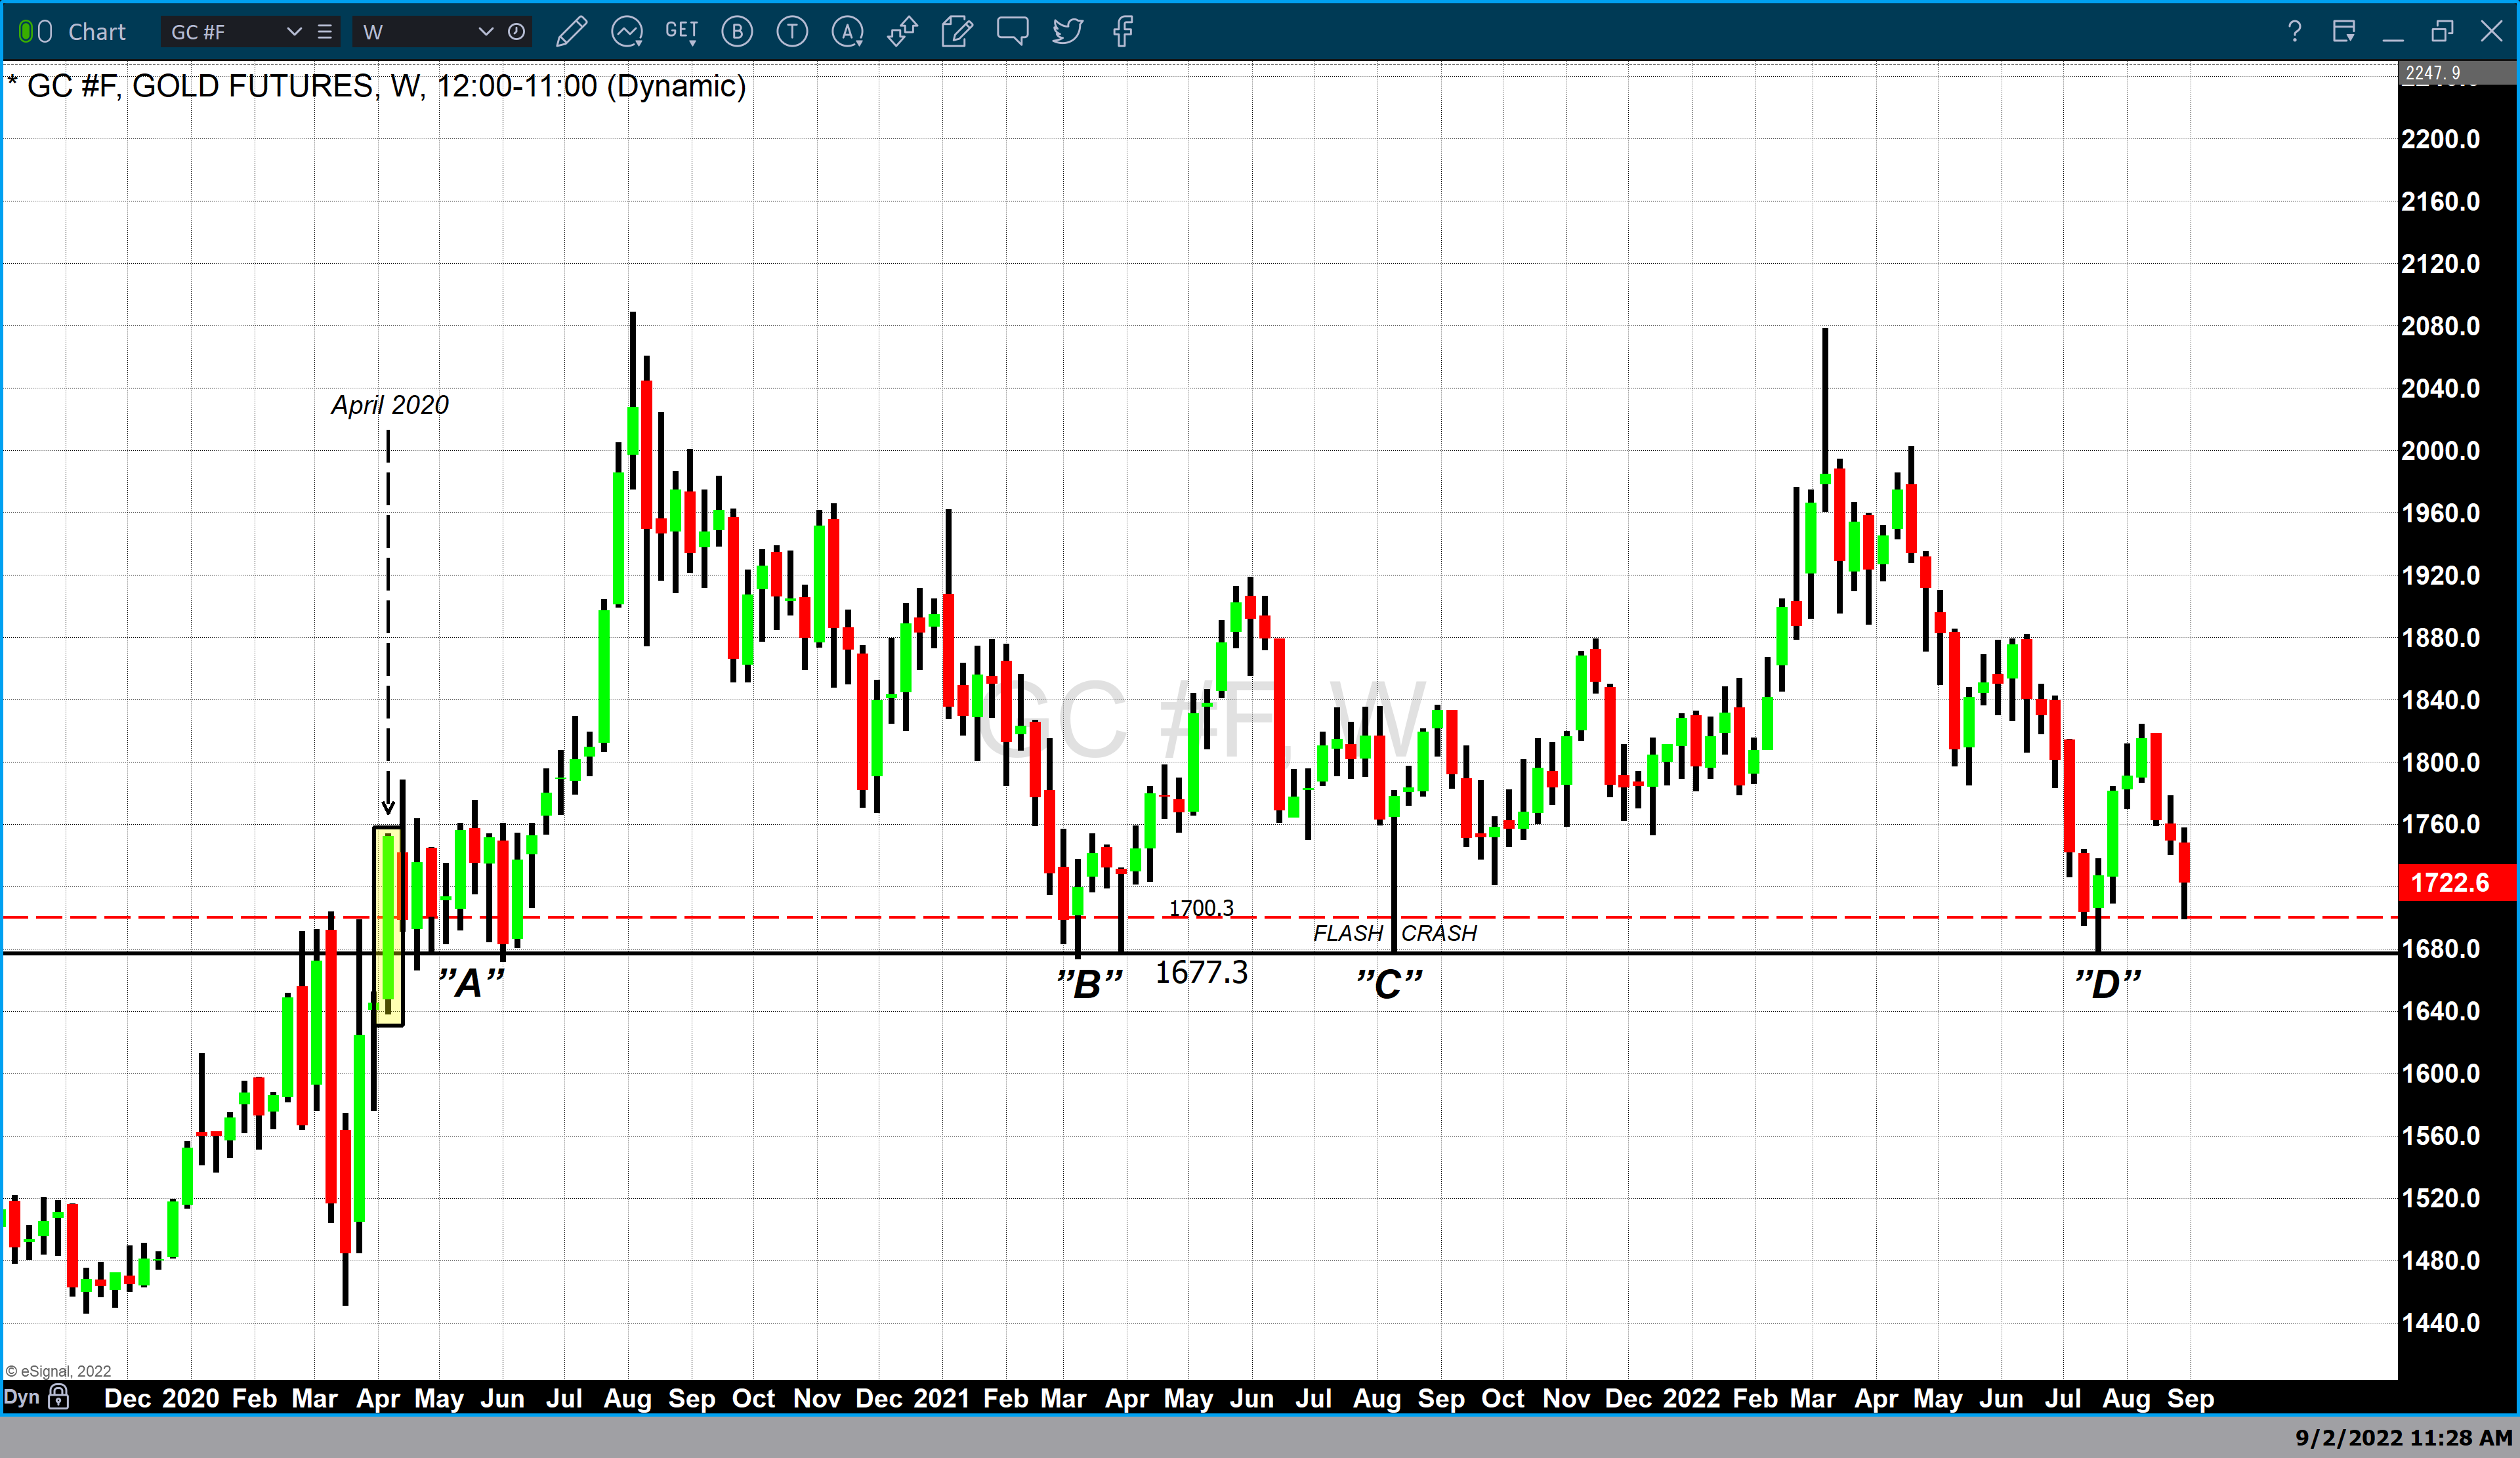
The chart above is a weekly chart of gold futures. This chart contains a dashed red line which is fixed at $1700 per ounce, a solid black line at $1680, and letters A through D that represent four time periods where gold traded to a low of $1680 and recovered.
In April 2020 gold broke and closed above $1680 and then $1700 for the first time since December 2012, this week is marked with a rectangular box. This would be followed by a 10-week price consolidation (“A”). During these 10 weeks, gold would test the lows of $1680 twice and on each occasion close above that price point. Although the low at $1680 became an effective support level gold pricing was unable to break above $1800. This would be the first instance after gold moved back above $1700 when $1680 became a key support level.
In March 2021 marked “B” on the weekly chart, gold would trade to a low of $1680 in two instances. On both occasions, gold closed above $1700 during that week after testing $1680. This takes us to the flash crash that occurred in August 2021 marked “C” on the chart above. The last occurrence of gold testing $1680 as a support level occurred in July 2022 and like the occurrence in March and August of 2021 gold would trade to a low of $1680 but close above $1700.
On a technical basis, it is clear that over the last three years gold prices have tested $1680 and on each and every occurrence of gold dropping to those lows effectively closed above that price point which makes $1680 a strong technical support level.
This week gold traded to a low of $1699 and is currently fixed at $1722.60 after factoring in yesterday’s recovery and today’s gain of $13.30. Based on the last four times that gold tested $1680 and recovered I would not be surprised to see gold once again test $1680 in the next couple of weeks, and although historical performance does not in any way guarantee that that $1680 will effectively hold and continue to be a strong level of support it seems that we can draw a line in the sand and acknowledge that this is a critical level and any break below that could lead to a strong price decline.
For those who would like more information simply use this link.
Wishing you as always good trading and good health,

Gary S. Wagner - Executive Producer