A sharp decline in gold results in major technical chart damage

Video section is only available for
PREMIUM MEMBERS
As a direct result of an exceedingly strong U.S. dollar gold prices plummeted today resulting in major technical chart damage. The dollar has gained significant value over the last two weeks, however, longer term studies reveal that the dollar has been on an upward trajectory since the beginning of 2021 when the dollar index was fixed at 90.
The dollar index compares the U.S. dollar to a basket of six major currencies. Today the dollar index gained 1.34% a total of 1.406 points and is currently fixed at 106.315. Although dollar strength has been growing over the last two years recently dollar strength accelerated satrting in March when the Federal Reserve began to raise interest rates for the first time since 2018.
Since the March interest rate hike of ¼%, the Federal Reserve has raised its fed funds rates from near zero to 1.5% - 1.75%. Over the last three FOMC meetings the Federal Reserve has raised its fed funds rate first by 25 basis points in March, 50 basis points in May, and 75 basis points in June. It is also anticipated that the Federal Reserve will raise rates another 75 basis points during the FOMC meeting at the end of this month.
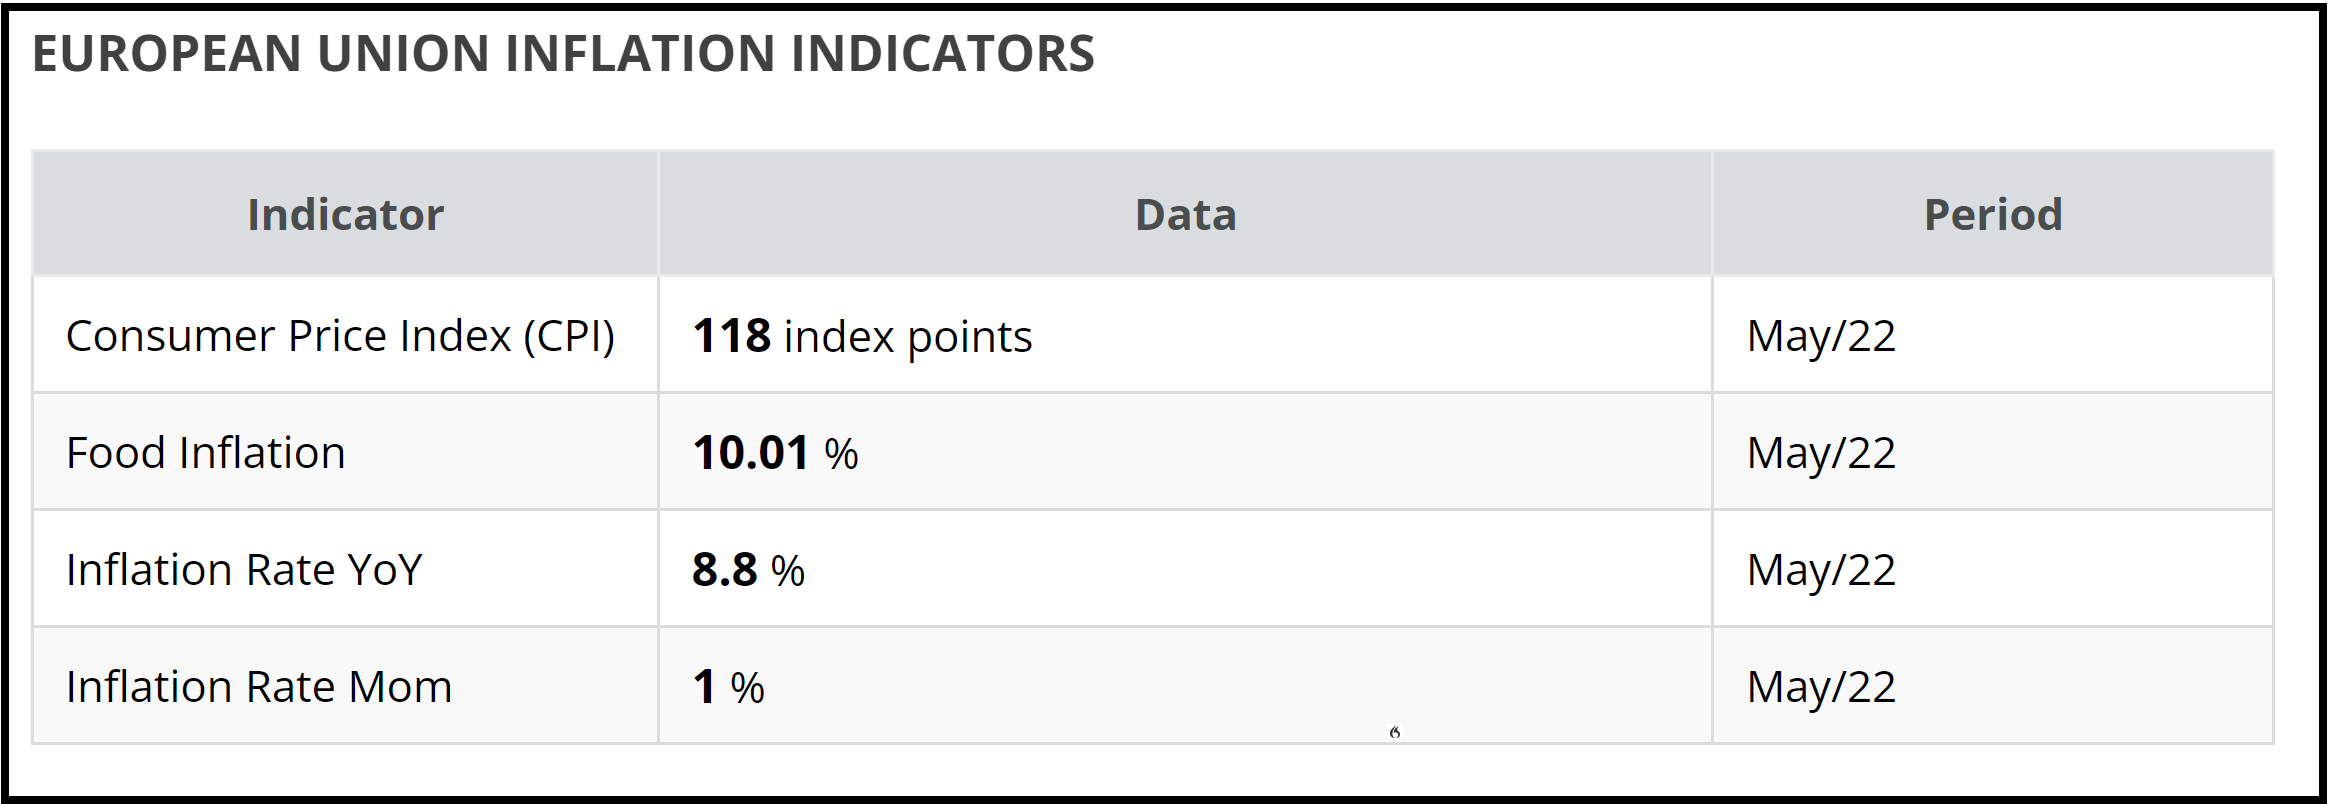
The rate hikes by the Federal Reserve have been in response to exceedingly high levels of inflation which continue to run at a 40-year high. The latest data from the U.S. government indicates that the CPI (Consumer Price Index) was at 8.3% in May. Just as alarming is the most recent economic data from Europe with the May 2022 Consumer Price Index for the Eurozone now fixed at 8.8% YoY.
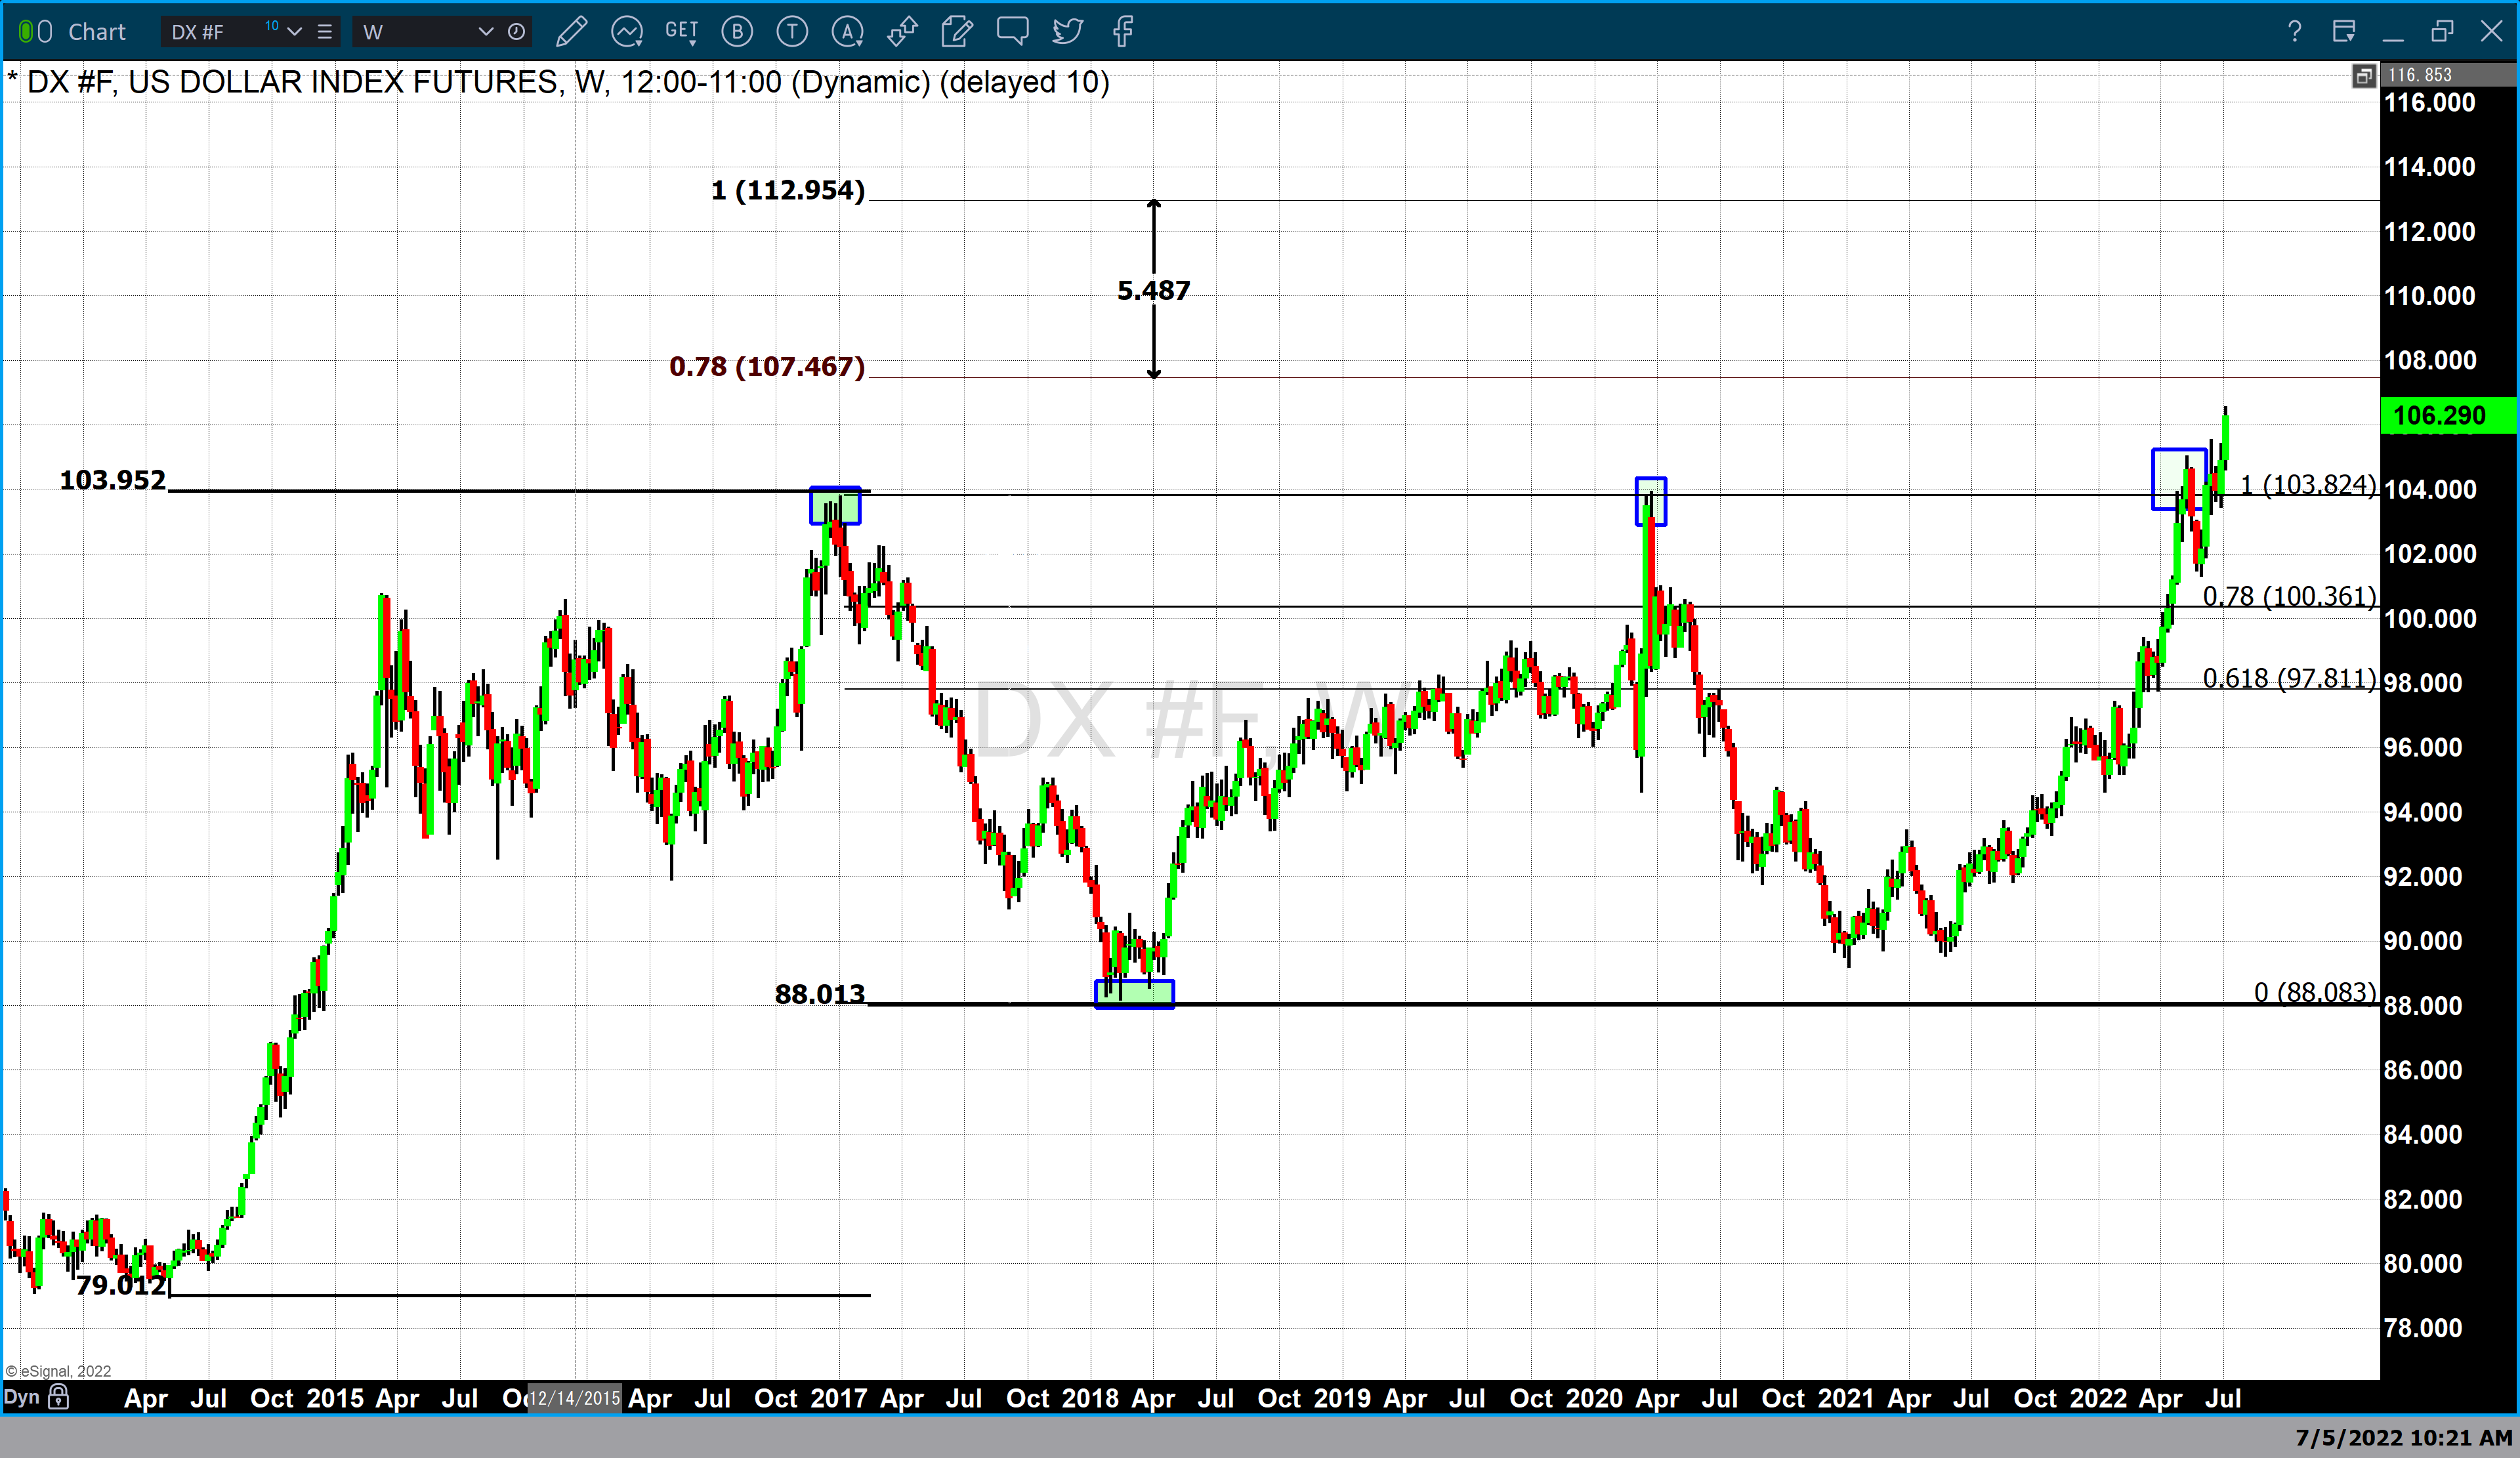
It has been rising interest rates that have been highly supportive of the dollar taking it to a 20-year high today. During the week of June 27, the dollar index opened just under 104 and has gained over 2% in the last six trading sessions. Based on the recent breakout in the dollar, our technical studies indicate that the next level of resistance does not occur until 107.467. Furthermore, it shows that major resistance on a technical level occurs at 112.95.
Fears of an inevitable recession based upon rising interest rates have fueled not only dollar strength but also selling pressure in gold on top of that. Collectively, these two forces have moved gold $300 lower from its yearly high in March of $2078 which is a price decline of 15.158%.
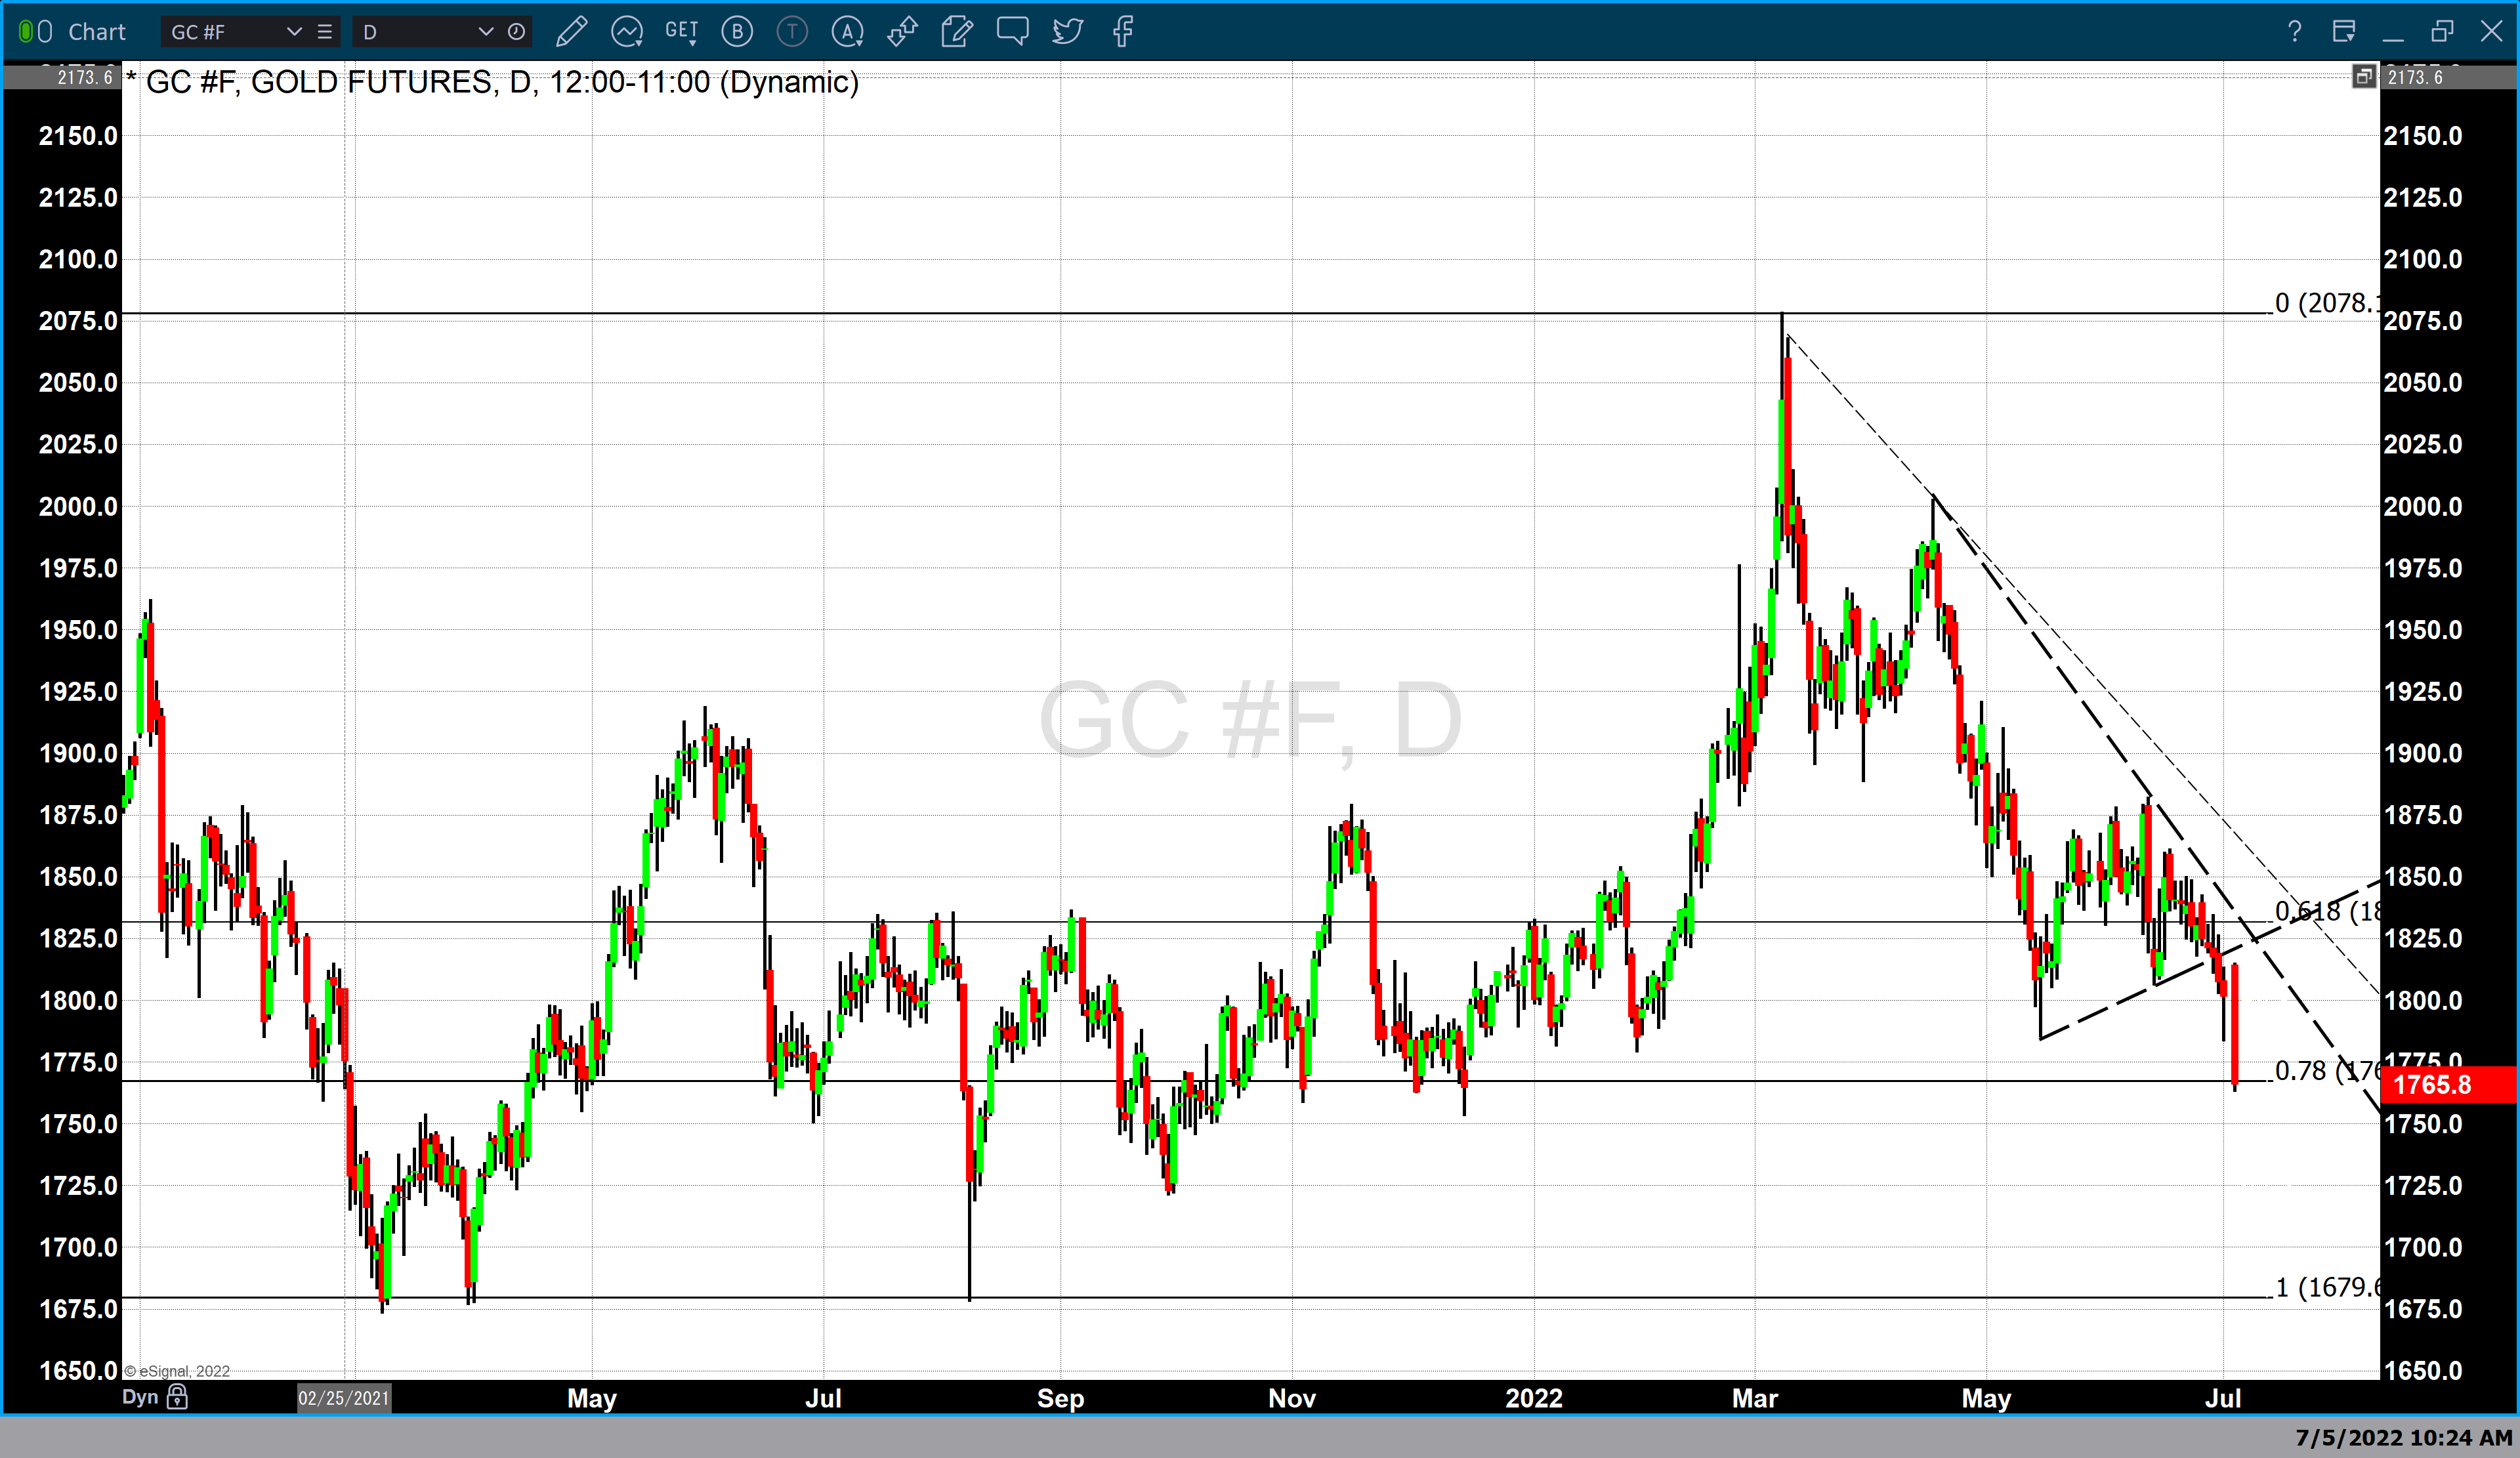
On a technical basis, this caused major chart damage from two important technical studies. First, today’s price decline took gold below its 78% Fibonacci retracement. The data set used for this retracement series begins in August 2020 when gold traded to a low of $1671 up to the high in March 2022 of $2078. The second technical study used to confirm that gold has sustained technical chart damage is a compression triangle. Today’s strong price decline took gold pricing through the lower support trendline. The support trendline was created by fixing the two most recent higher lows. The first low occurred on March 16 when gold traded to a low of $1785 with the second low being fixed at $1805 a low that occurred during mid-June this year.
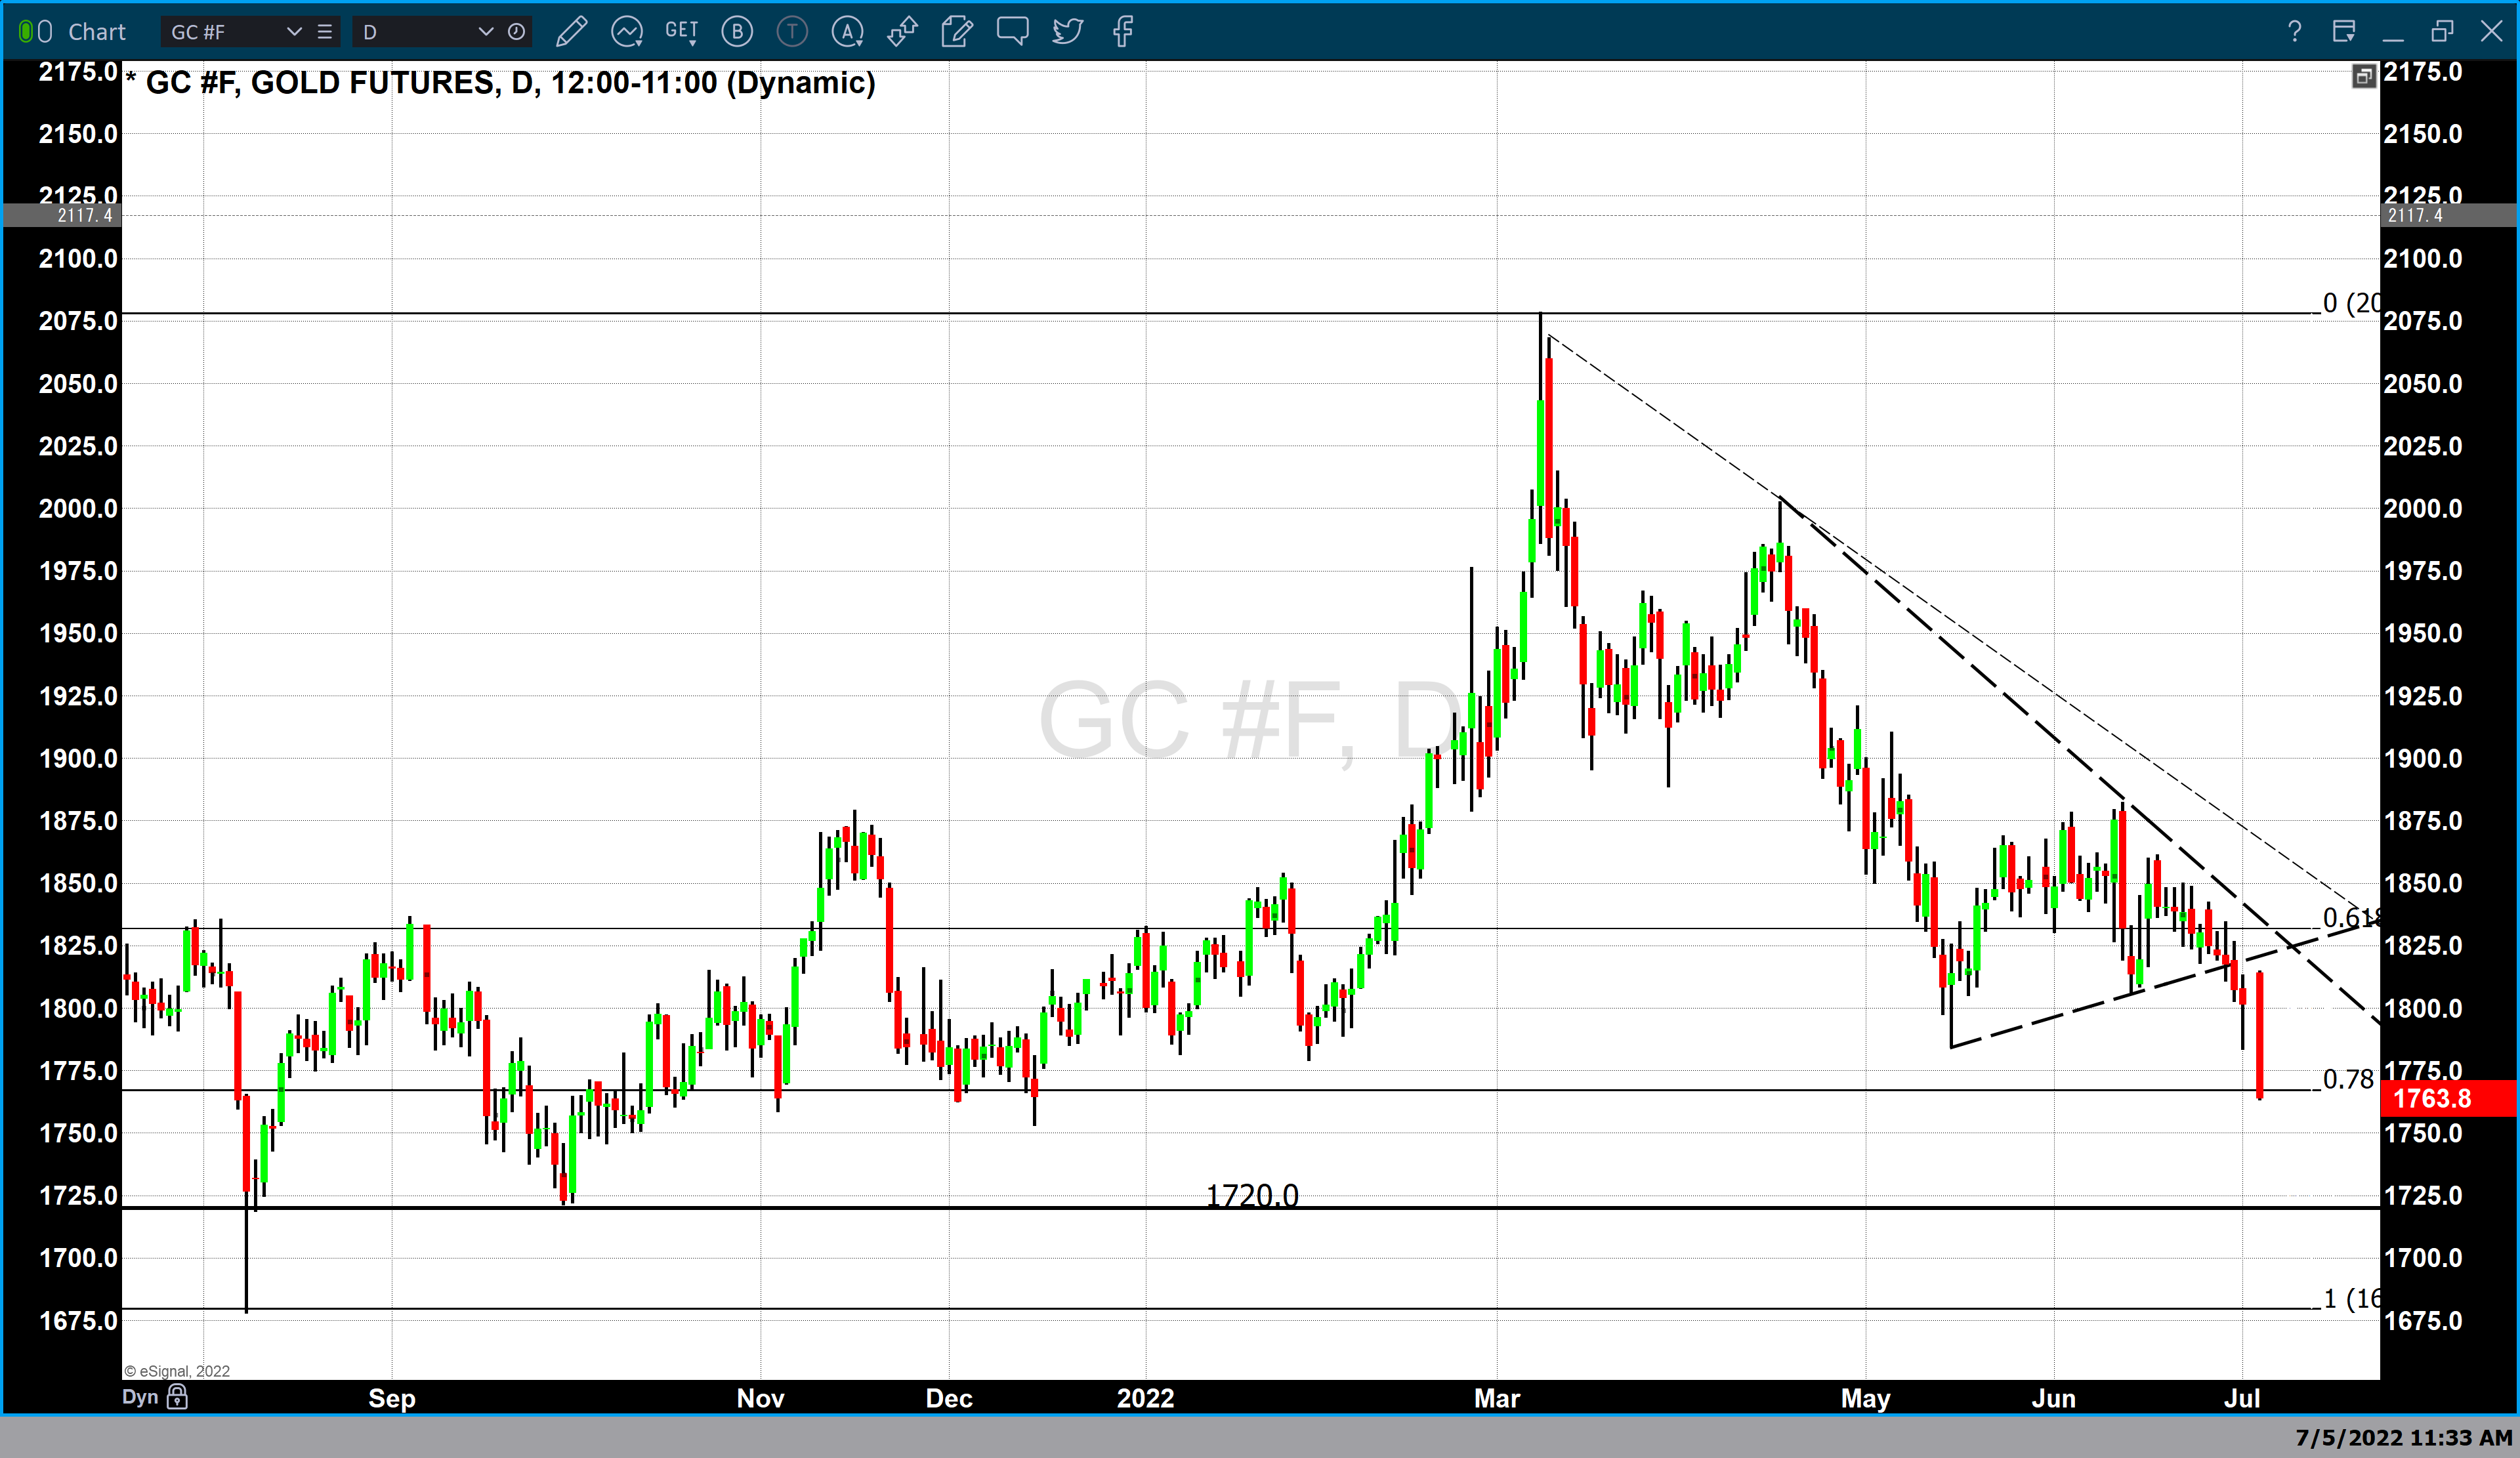
Based on continued selling pressure in gold capped by today’s $35 plus decline the question becomes where could gold find technical support? The chart above looks at potential support levels by looking at the most recent price bottoms. The first potential level for support occurs at $1720. This level is based upon a short-term low that was seen in October 2021. Below that is the low of August 2020 when gold hit $1673 before recovering and trading higher.
Wishing you as always good trading,

Gary S. Wagner - Executive Producer