Western and Eastern technical studies suggest a bullish reversal in gold has occurred

Video section is only available for
PREMIUM MEMBERS
Gold traded to its lowest value in the last nine trading days with market forces taking the June 2022 futures contract to $1870.90 this morning. After opening at $1886.80, gold futures drifted lower and then recovered strongly. As of 4:30 PM EDT, the most active June 2022 gold contract is fixed at $1896.20 which is a net gain of $7.50. More importantly if it finishes this Globex session at these levels it will be a strong indication that the support level at $1885 is active support. However, when we combine today’s price range with Eastern and Western technical analysis a case can be made that a pivot or key reversal has resulted from today’s price action.
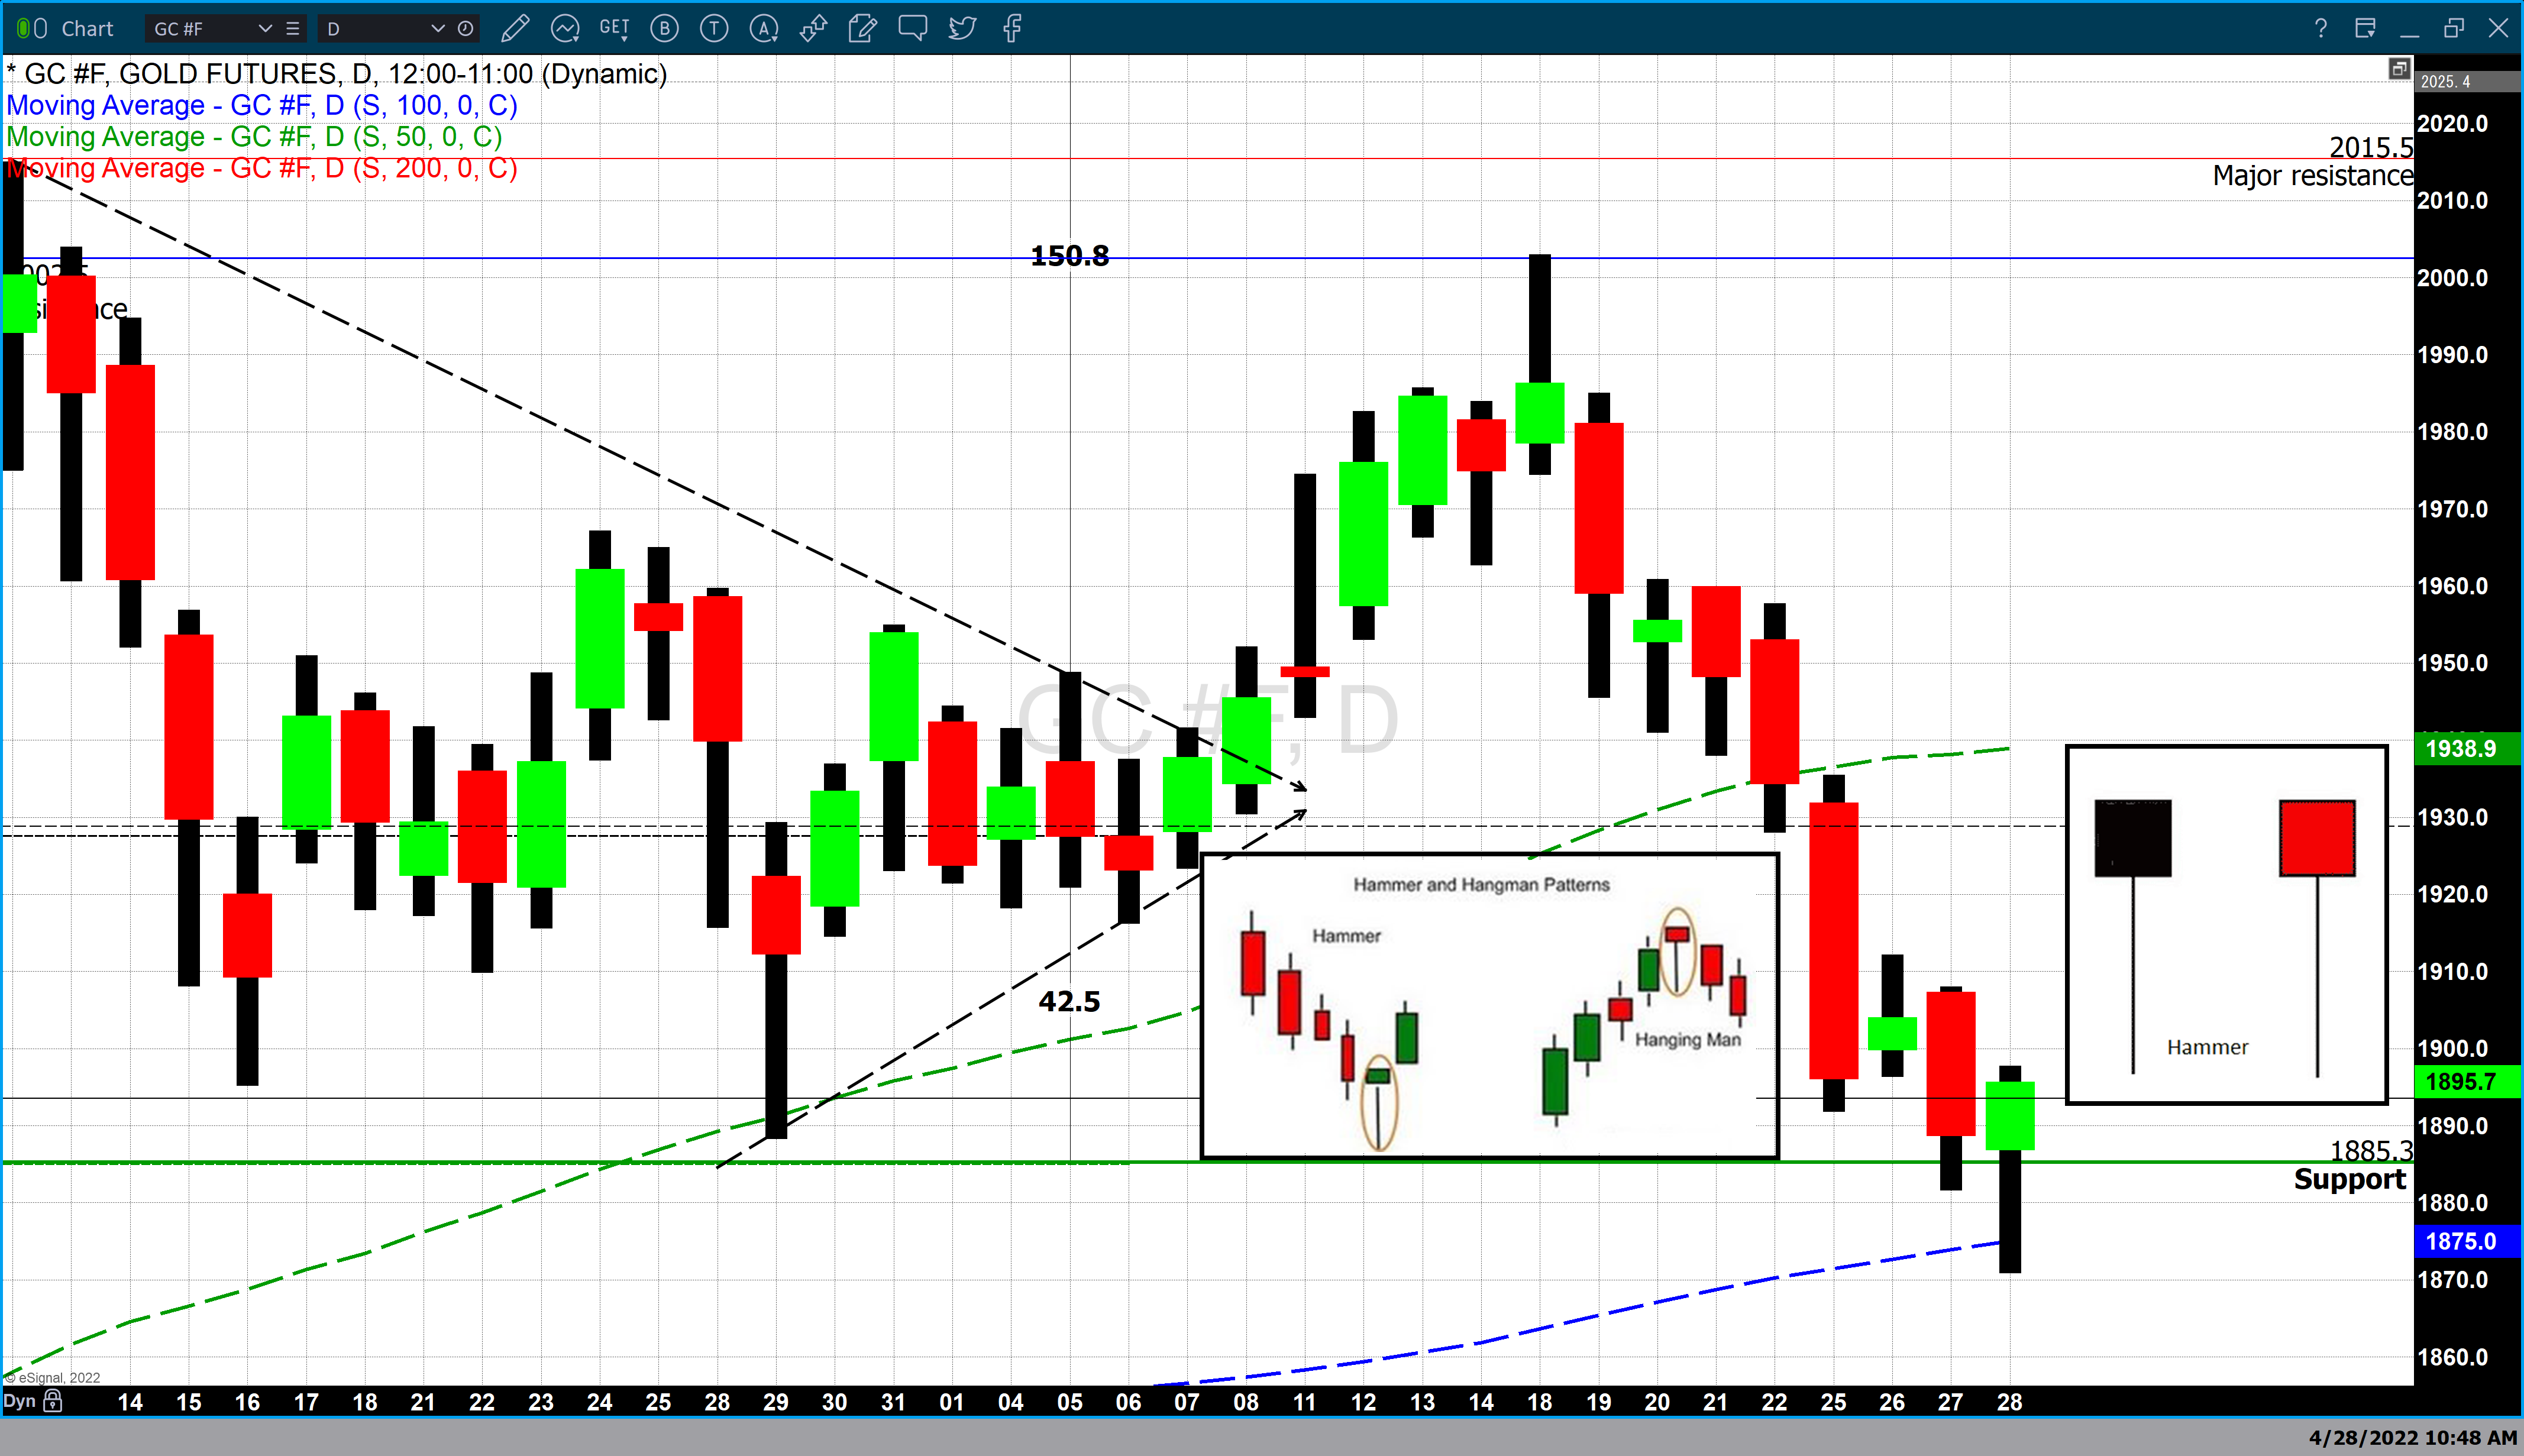
Chart #1 is a daily gold chart that we have used and published in which we highlighted the support level we had identified at $1885. This chart also clearly illustrates that the intraday low this morning moved just below gold’s 100-day moving average.

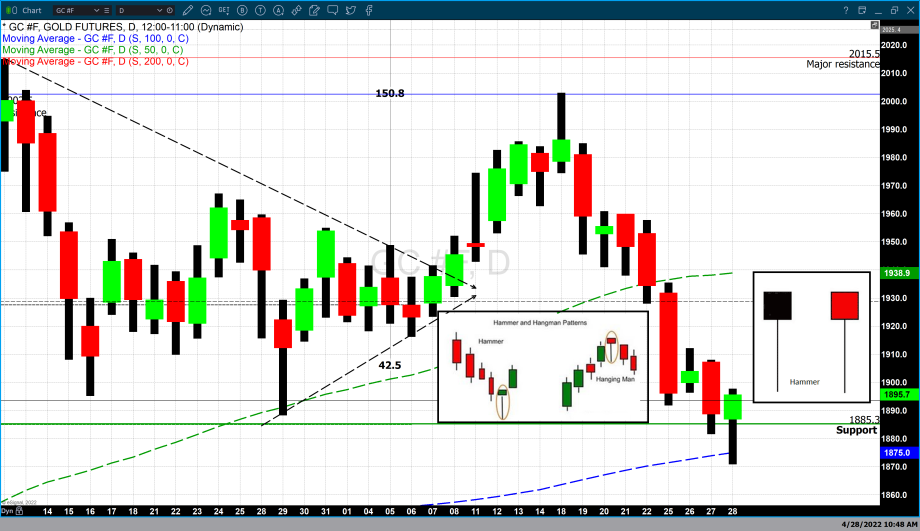
Chart # 2 is the daily chart enlarged to better view the daily Japanese candlestick to identify it. The candlestick chart allows us to easily visualize the open and closing price, represented as a rectangle. The rectangle is filled in green, indicating that the close is currently above the opening price (a red candle indicates that the current pricing or the close is below its opening price). In the case of today’s open and closing range, which is labeled as the “real body” in a candlestick chart, we can see that it opened and closed above the support at $1885 that we have identified.
A single Japanese candlestick can also be identified. The candlestick that formed today can be branded as a “Hammer.” This single candlestick is part of a group known as the umbrella lines and consists of four primary candles labeled; hammer, shooting star, hangman, and inverted hammer. Umbrella lines are candles that show either very long lower shadows and small bodies near the top of the trading range or very long upper shadows and small bodies near the bottom of the trading range.
The “Hammer – Hangman” is the same except for their location within a trend. Therefore, depending on its location, it will be interpreted as a bullish or a bearish candlestick. If it appears during a downtrend, it can indicate that the correction has concluded. In such places, we name it a hammer. If the same candlestick appears after a defined uptrend, it is labeled as a “Hang-man.”
While a single candlestick cannot indicate a potential pivot or reversal if it occurs within other variables, it can be a strong indication that a bullish reversal is taking place. Today’s low fell below the 100-day moving average creating a long lower wick. This long lower wick occurs below both the open and closing price, which illustrates that when prices moved to today’s low, buyers quickly stepped into the market and bought the dip. These buyers could be covering short positions or initiating long positions. Also, the real body (which is created from the open and closing price) of today’s candlestick occurs above the support level at $1885.
This becomes an extremely important and valid piece of information, if tomorrow’s candlestick is a long green candle with a higher high and a higher low than today’s, it would be labeled as a confirming candle. All of these factors would strengthen the assumption that the correction, which began on April 18, taking gold from $2003 per ounce to today’s low of $1870, has concluded.
Wishing you as always good trading,

Gary S. Wagner - Executive Producer
