The dollar has declined for three consecutive days and gold is beginning to respond

Video section is only available for
PREMIUM MEMBERS
The dollar is now in its third consecutive day of trading lower. The dollar hit its highest value of 107.05 on Tuesday, October 3. This is the highest value of the index and almost a year. The last time the dollar index was at 107 occurred at the end of November 2022. On Tuesday when the dollar index hit its highest value of this current rally which began in July after trading from a low just above 99. The daily candlestick that occurred was a” doji” (どうじ/ 同事).
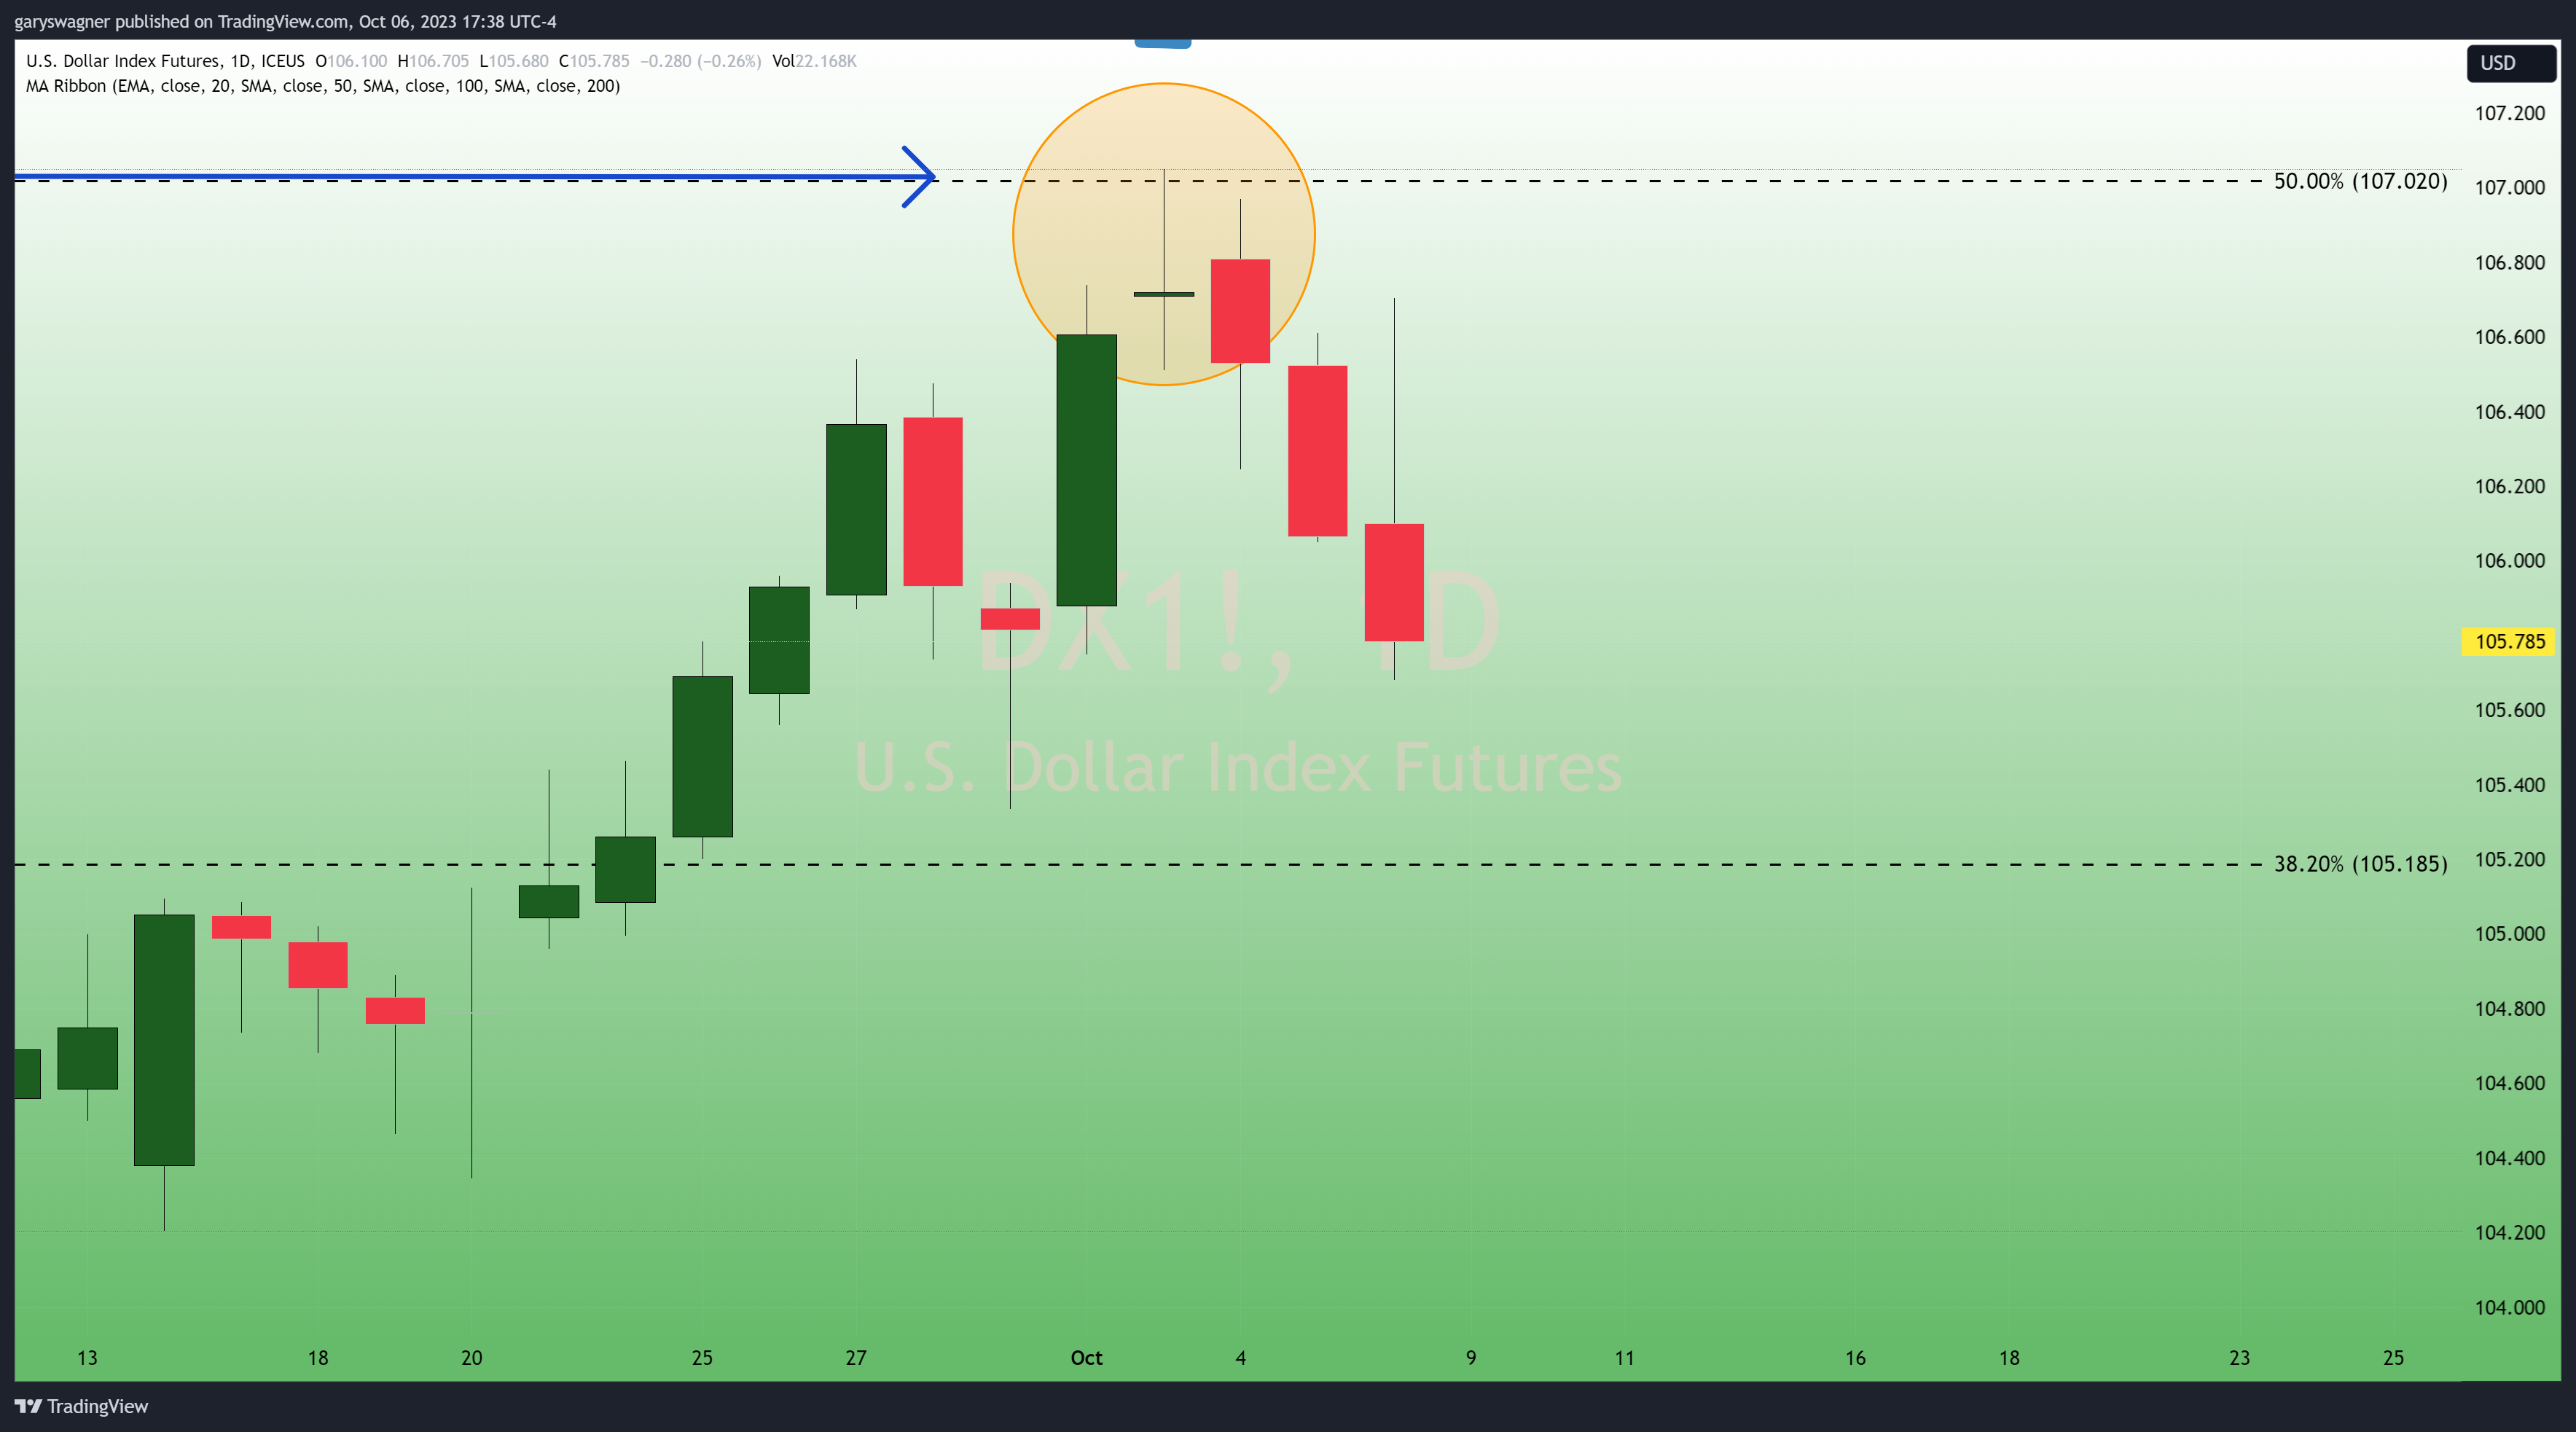
To the Eastern technical trader, this candlestick type can be extremely important and significant. In Japanese, the meaning of “doji” is “the same thing” and is a reference to not only the rarity but a description of when a stock or commodity opens and closes at the same price point, or a tick apart. The doji is important as a standalone candlestick but can also be the central candlestick to a larger pattern such as a doji star. A doji star occurs when the real body (open and closing price) gap above or below the prior session's candle.
This single candlestick occurs when neither the bullish nor bearish faction can dominate the market resulting in an open and closing price that are the same. While it can be simply an indication of market consolidation in its best-case scenario it can reveal a moment in time when momentum shifts, and a pivot or key reversal occurs.
According to Investopedia, “Although rare, a doji candlestick generally signals a trend reversal indication for analysts, although it can also signal indecision about future prices. Broadly, candlestick charts can reveal information about market trends, sentiment, momentum, and volatility. The patterns that form in the candlestick charts are signals of such market actions and reactions.”
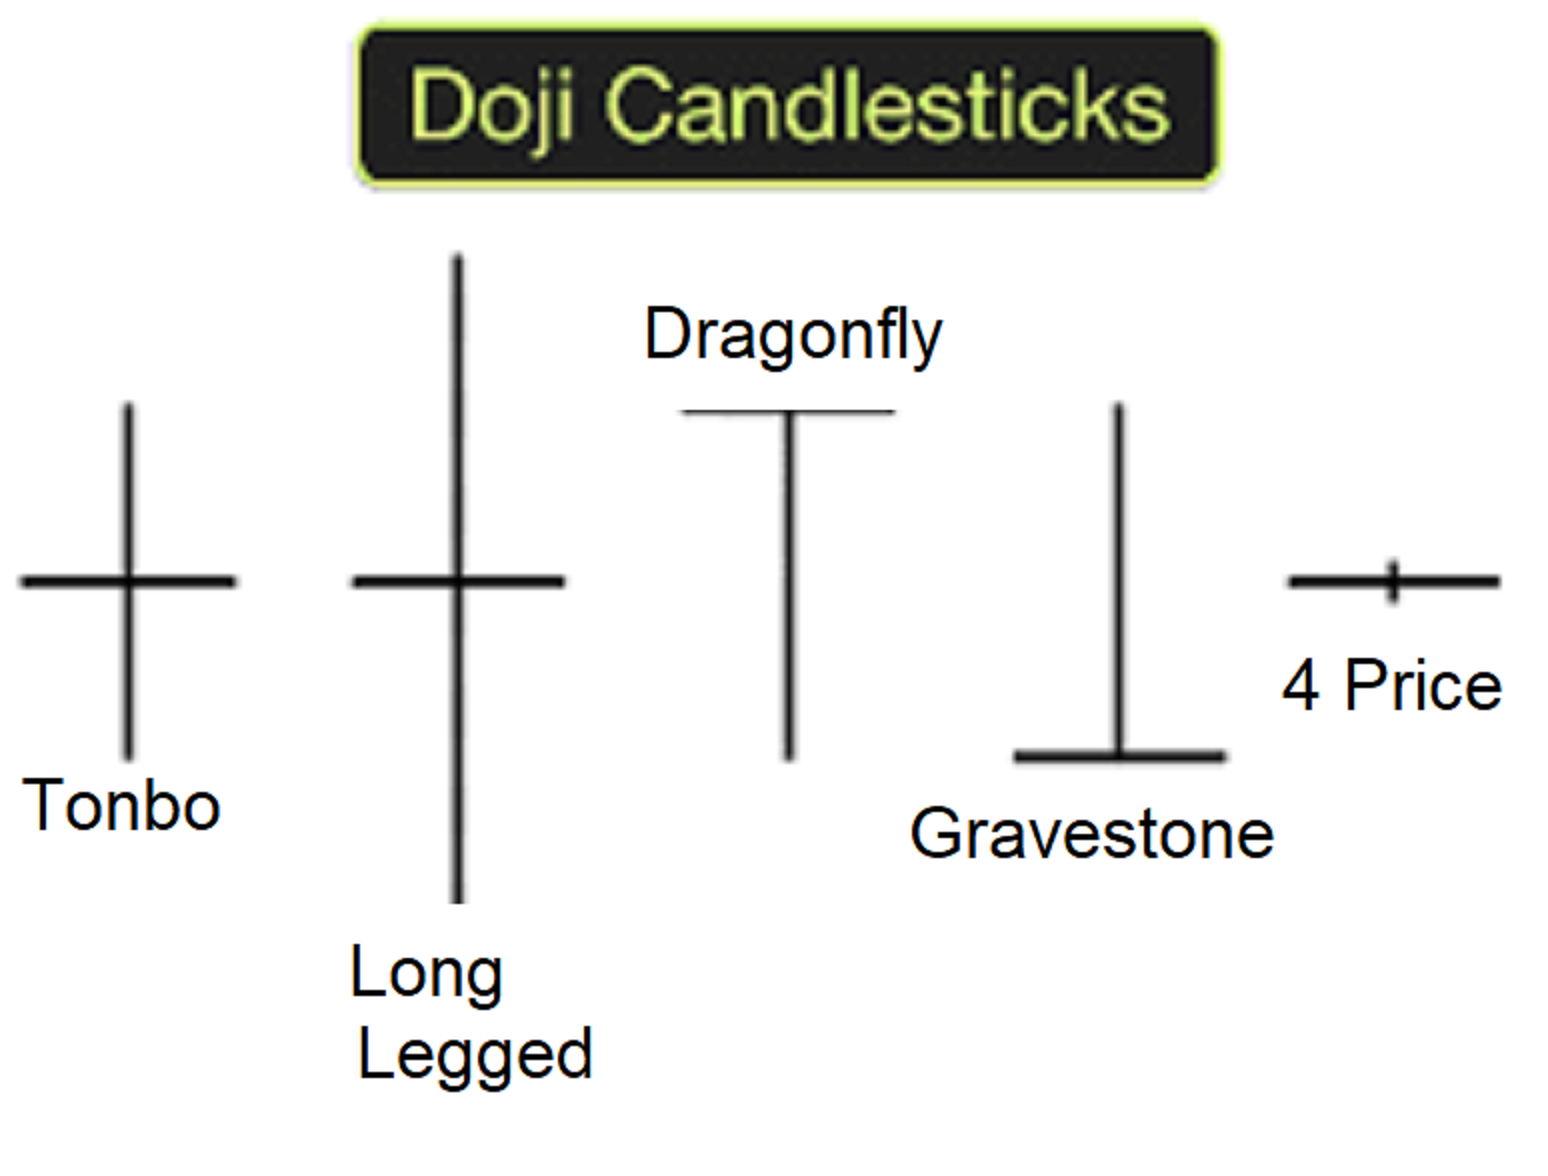
In his book, “The Japanese Chart of Charts”, Seiki Shimizu identifies five types of doji candlesticks based on the location of the real body as well as the length of the wick. The five types are long-legged, dragonfly, gravestone, four-price, and tonbo. Seiki Shimizu's book was the first book on the Eastern art of technical analysis translated into English in 1986. In fact, it can be said that he single-handedly brought the awareness and importance of this style of charting price movement over time to the Western trader.
A technical look at gold futures
While it is clear that recent dollar strength has pressured gold lower, the opposite will be true if this trend continues and this recent price decline signals the beginning of a correction.
Also, as we spoke about yesterday we have identified chart patterns based on both Eastern and Western technical analysis indicating that gold was very oversold.
While multiple Western technical indicators have concluded that gold pricing is oversold. Eastern and Western technical exhaustion patterns were discussed in yesterday’s article but with today’s price advance, gold seems to hold a lot more weight.
The Eastern technical pattern is called an “8 to 10 new price low”, and Tom DeMark’s Western method which is based on his observation of “a multiphase indicator that analyzes price data. One of his primary indicators is simply labeled “9 ®”. He explains this sequential pattern using the number nine in the following way. “A 9 indication marks a completion of the setup phase.
As of 6:00 PM EDT, the most active December contract of gold futures has gained $13.40 and is currently fixed at $1845.20. It will be interesting to see if we see follow-through in buying next week confirming a key reversal has taken place today.
Wishing you as always good trading,

Gary S. Wagner - Executive Producer