Dollar strength and bond yields wane, yet gold continues to decline

Video section is only available for
PREMIUM MEMBERS
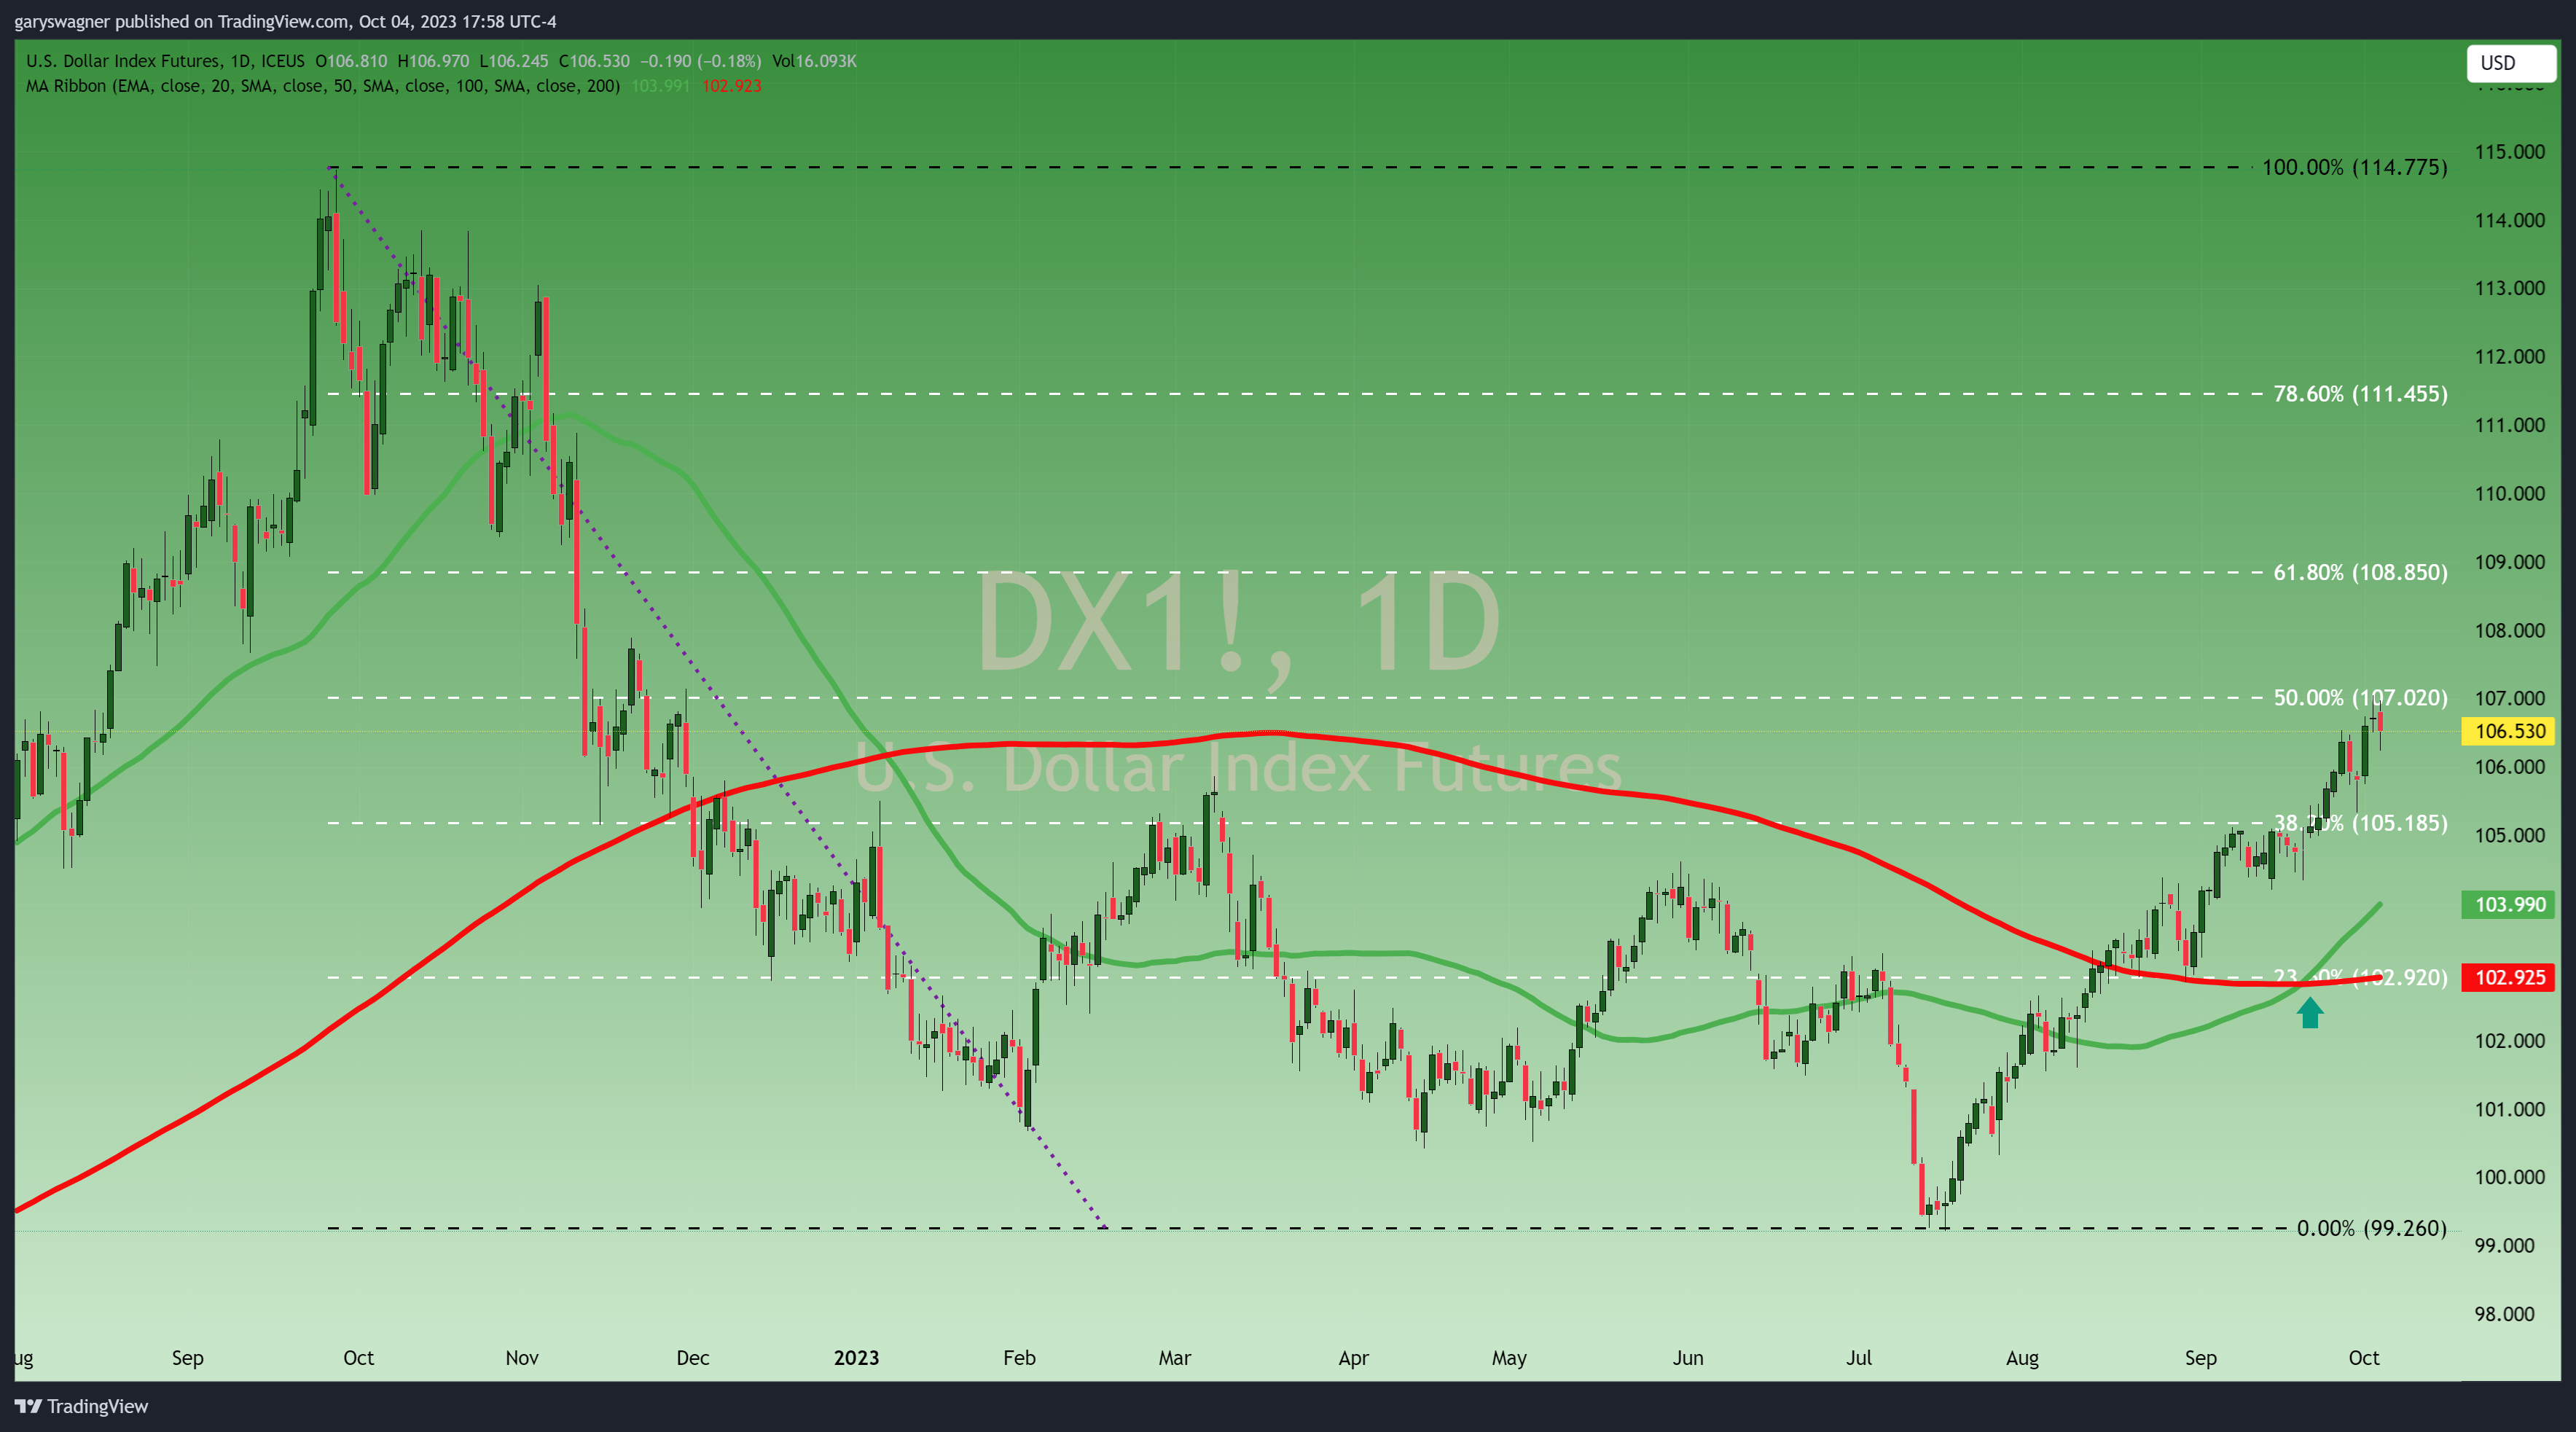
The dollar opened at 106.81, traded to an intraday high of 106.97 (just below yesterday’s high), and then traded to a lower low and lower close than yesterday. Currently, the dollar index is down - 0.18% and fixed at 106.53. The chart below is a long-term daily Japanese candlestick chart of the dollar index. We have created a Fibonacci retracement from a data set beginning at the high of 114.65 achieved on September 27, 2022, to the low of 99.26 which occurred on July 18. The intraday high from both yesterday and today roughly matches the 50% retracement at 107.02.
Despite Dollar weakness and yields declining gold futures continued to trade lower. The most active December futures contract opened at $1838.70 and is currently fixed at $1834.80 after factoring in today’s decline of $6.70 or – 0.36%. Gold futures fell to their lowest value since a double bottom formed at the end of February and the beginning of March. The chart below is a daily candlestick chart of the continuous futures contract of gold which contains the MACD which indicates that gold prices are oversold. However, the two moving averages are moving very close to the formation of a death cross, which is created when the short-term 50-day moving average (solid green line) crosses below the long-term 200-day moving average (solid red line).
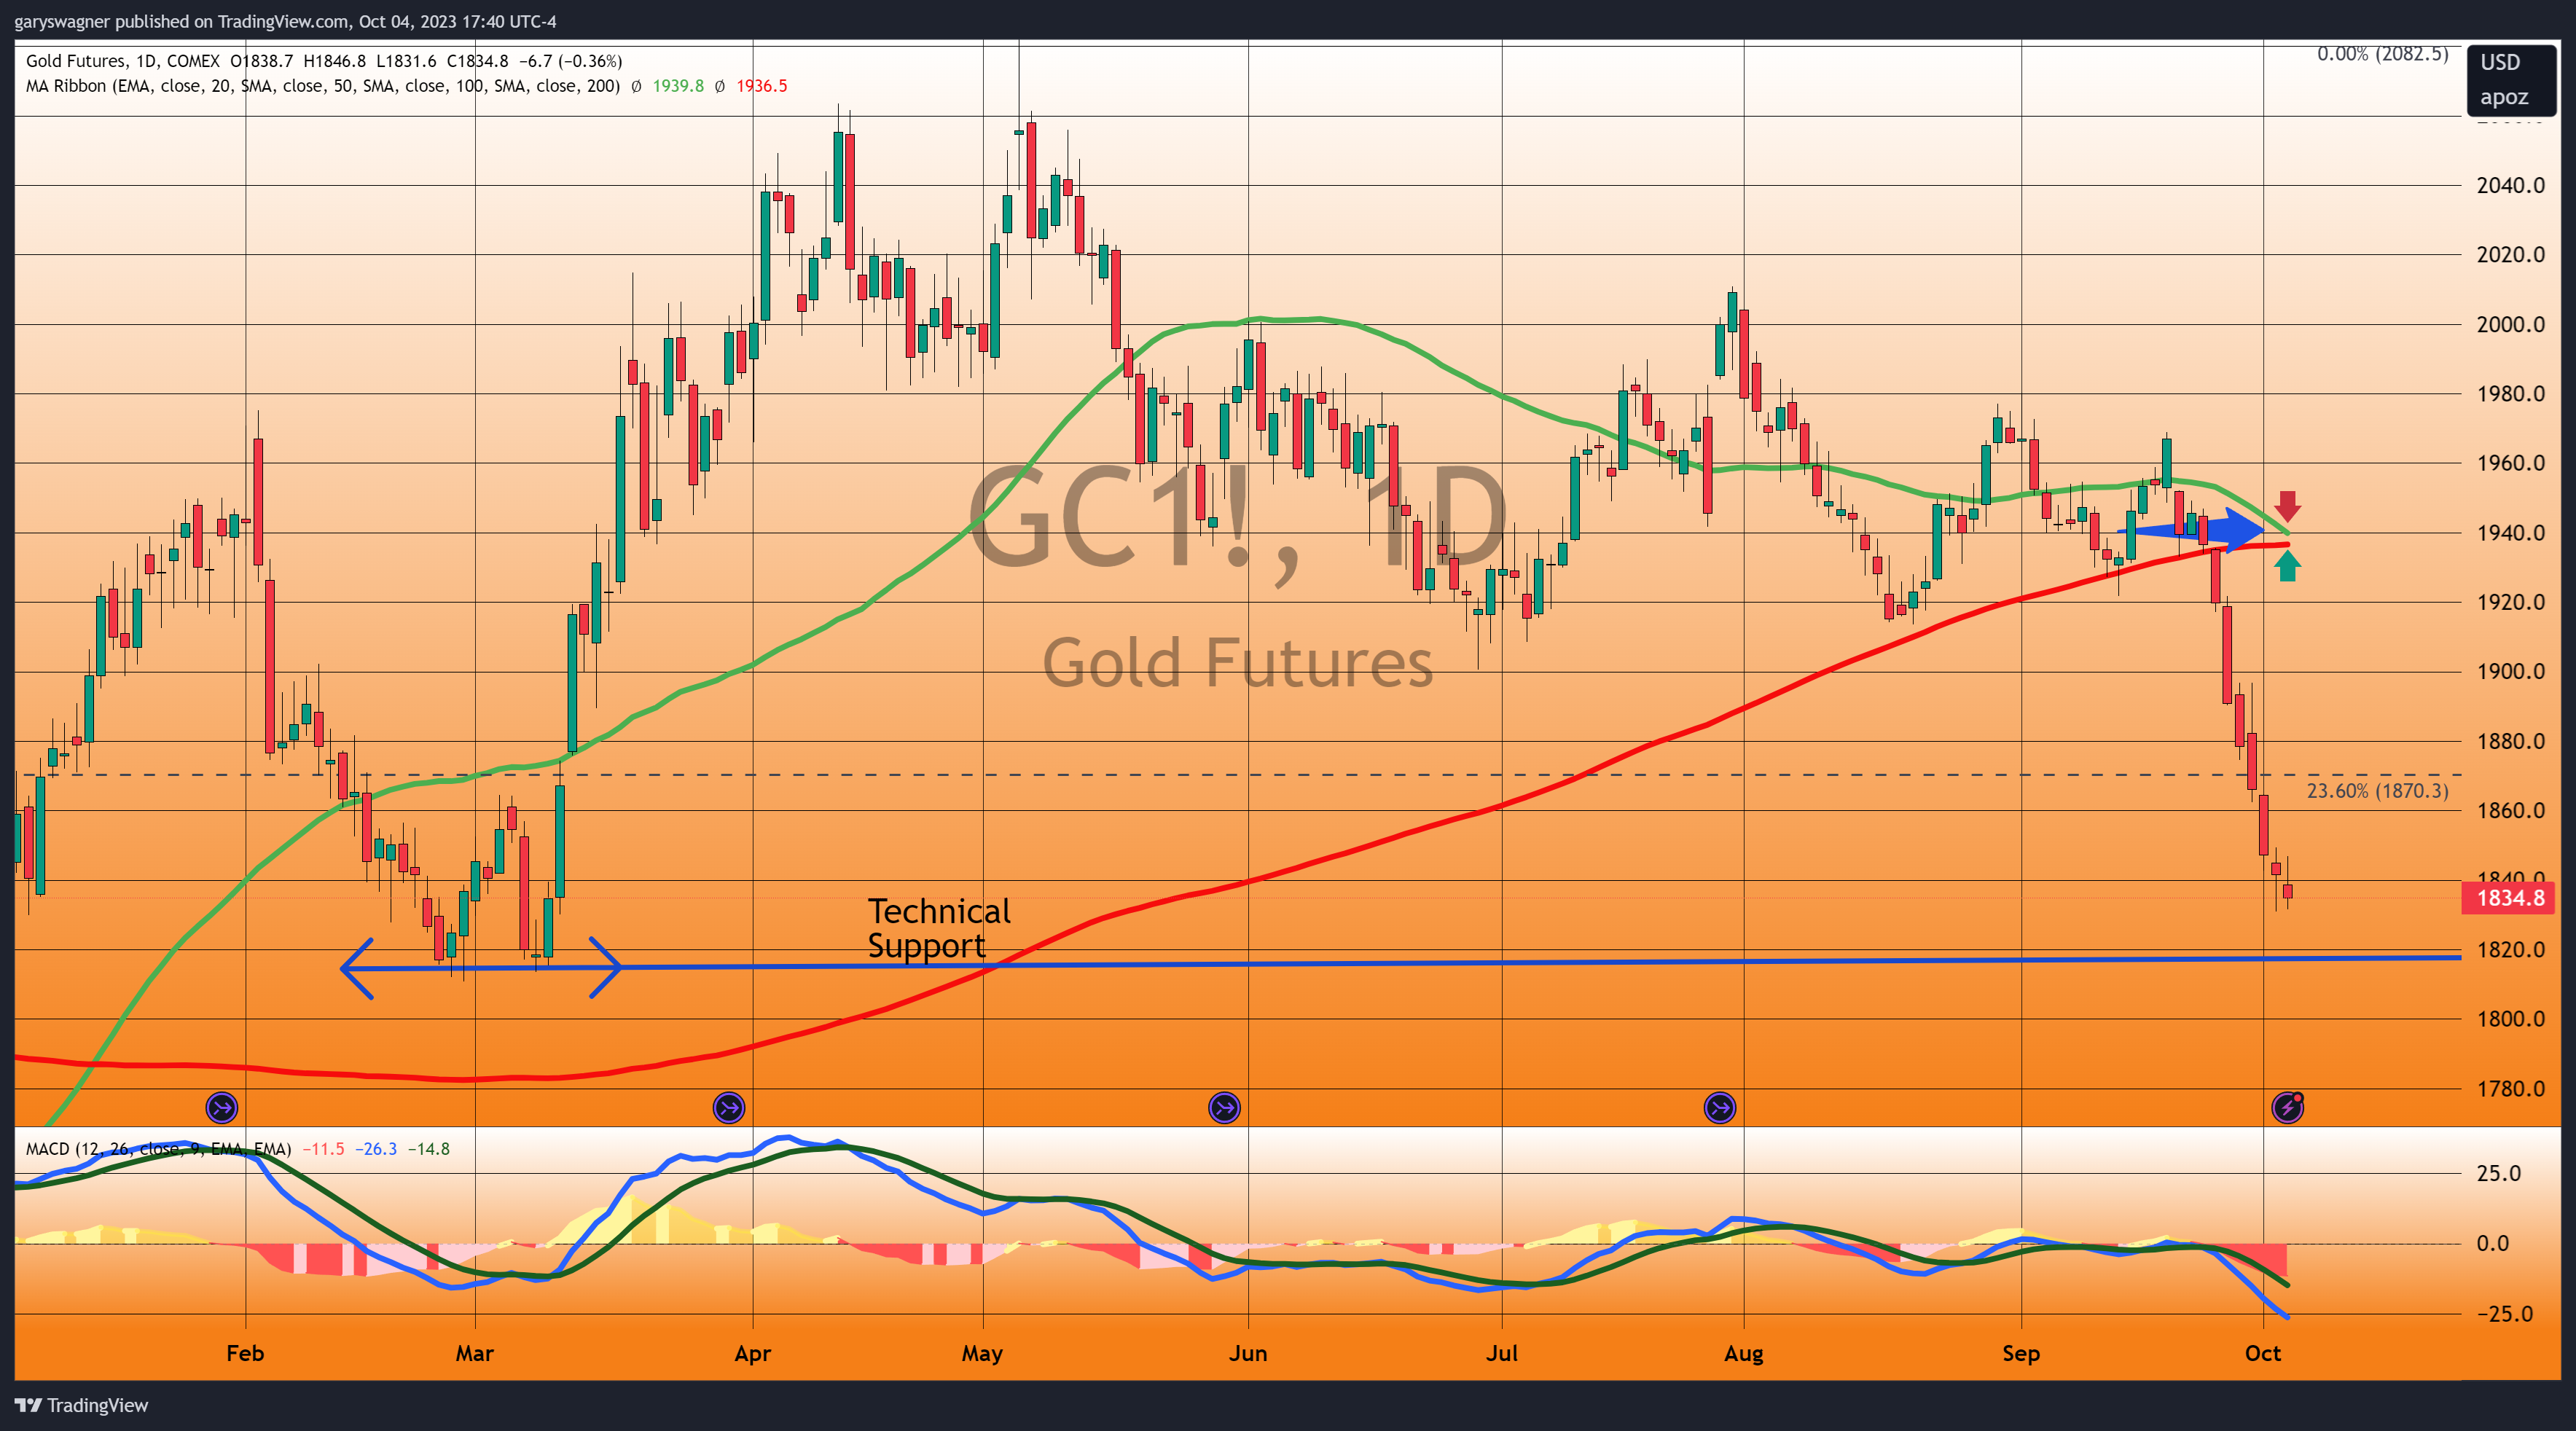
According to Investopedia, “The "death cross" is a market chart pattern reflecting recent price weakness. It refers to the drop of a short-term moving average—meaning the average of recent closing prices for a stock, stock index, commodity, or cryptocurrency over a set time—below a longer-term moving average.”
Recent pressure has resulted in eight consecutive price declines with each daily candlestick trading to a lower low, a lower high, and a lower close than the previous day. The eight daily candlesticks are also colored in red which is significant because it indicates that gold futures closed below their opening price. The one caveat to the decline over the last two days is the contraction of the real body size (the rectangle drawn around the open and closing price).
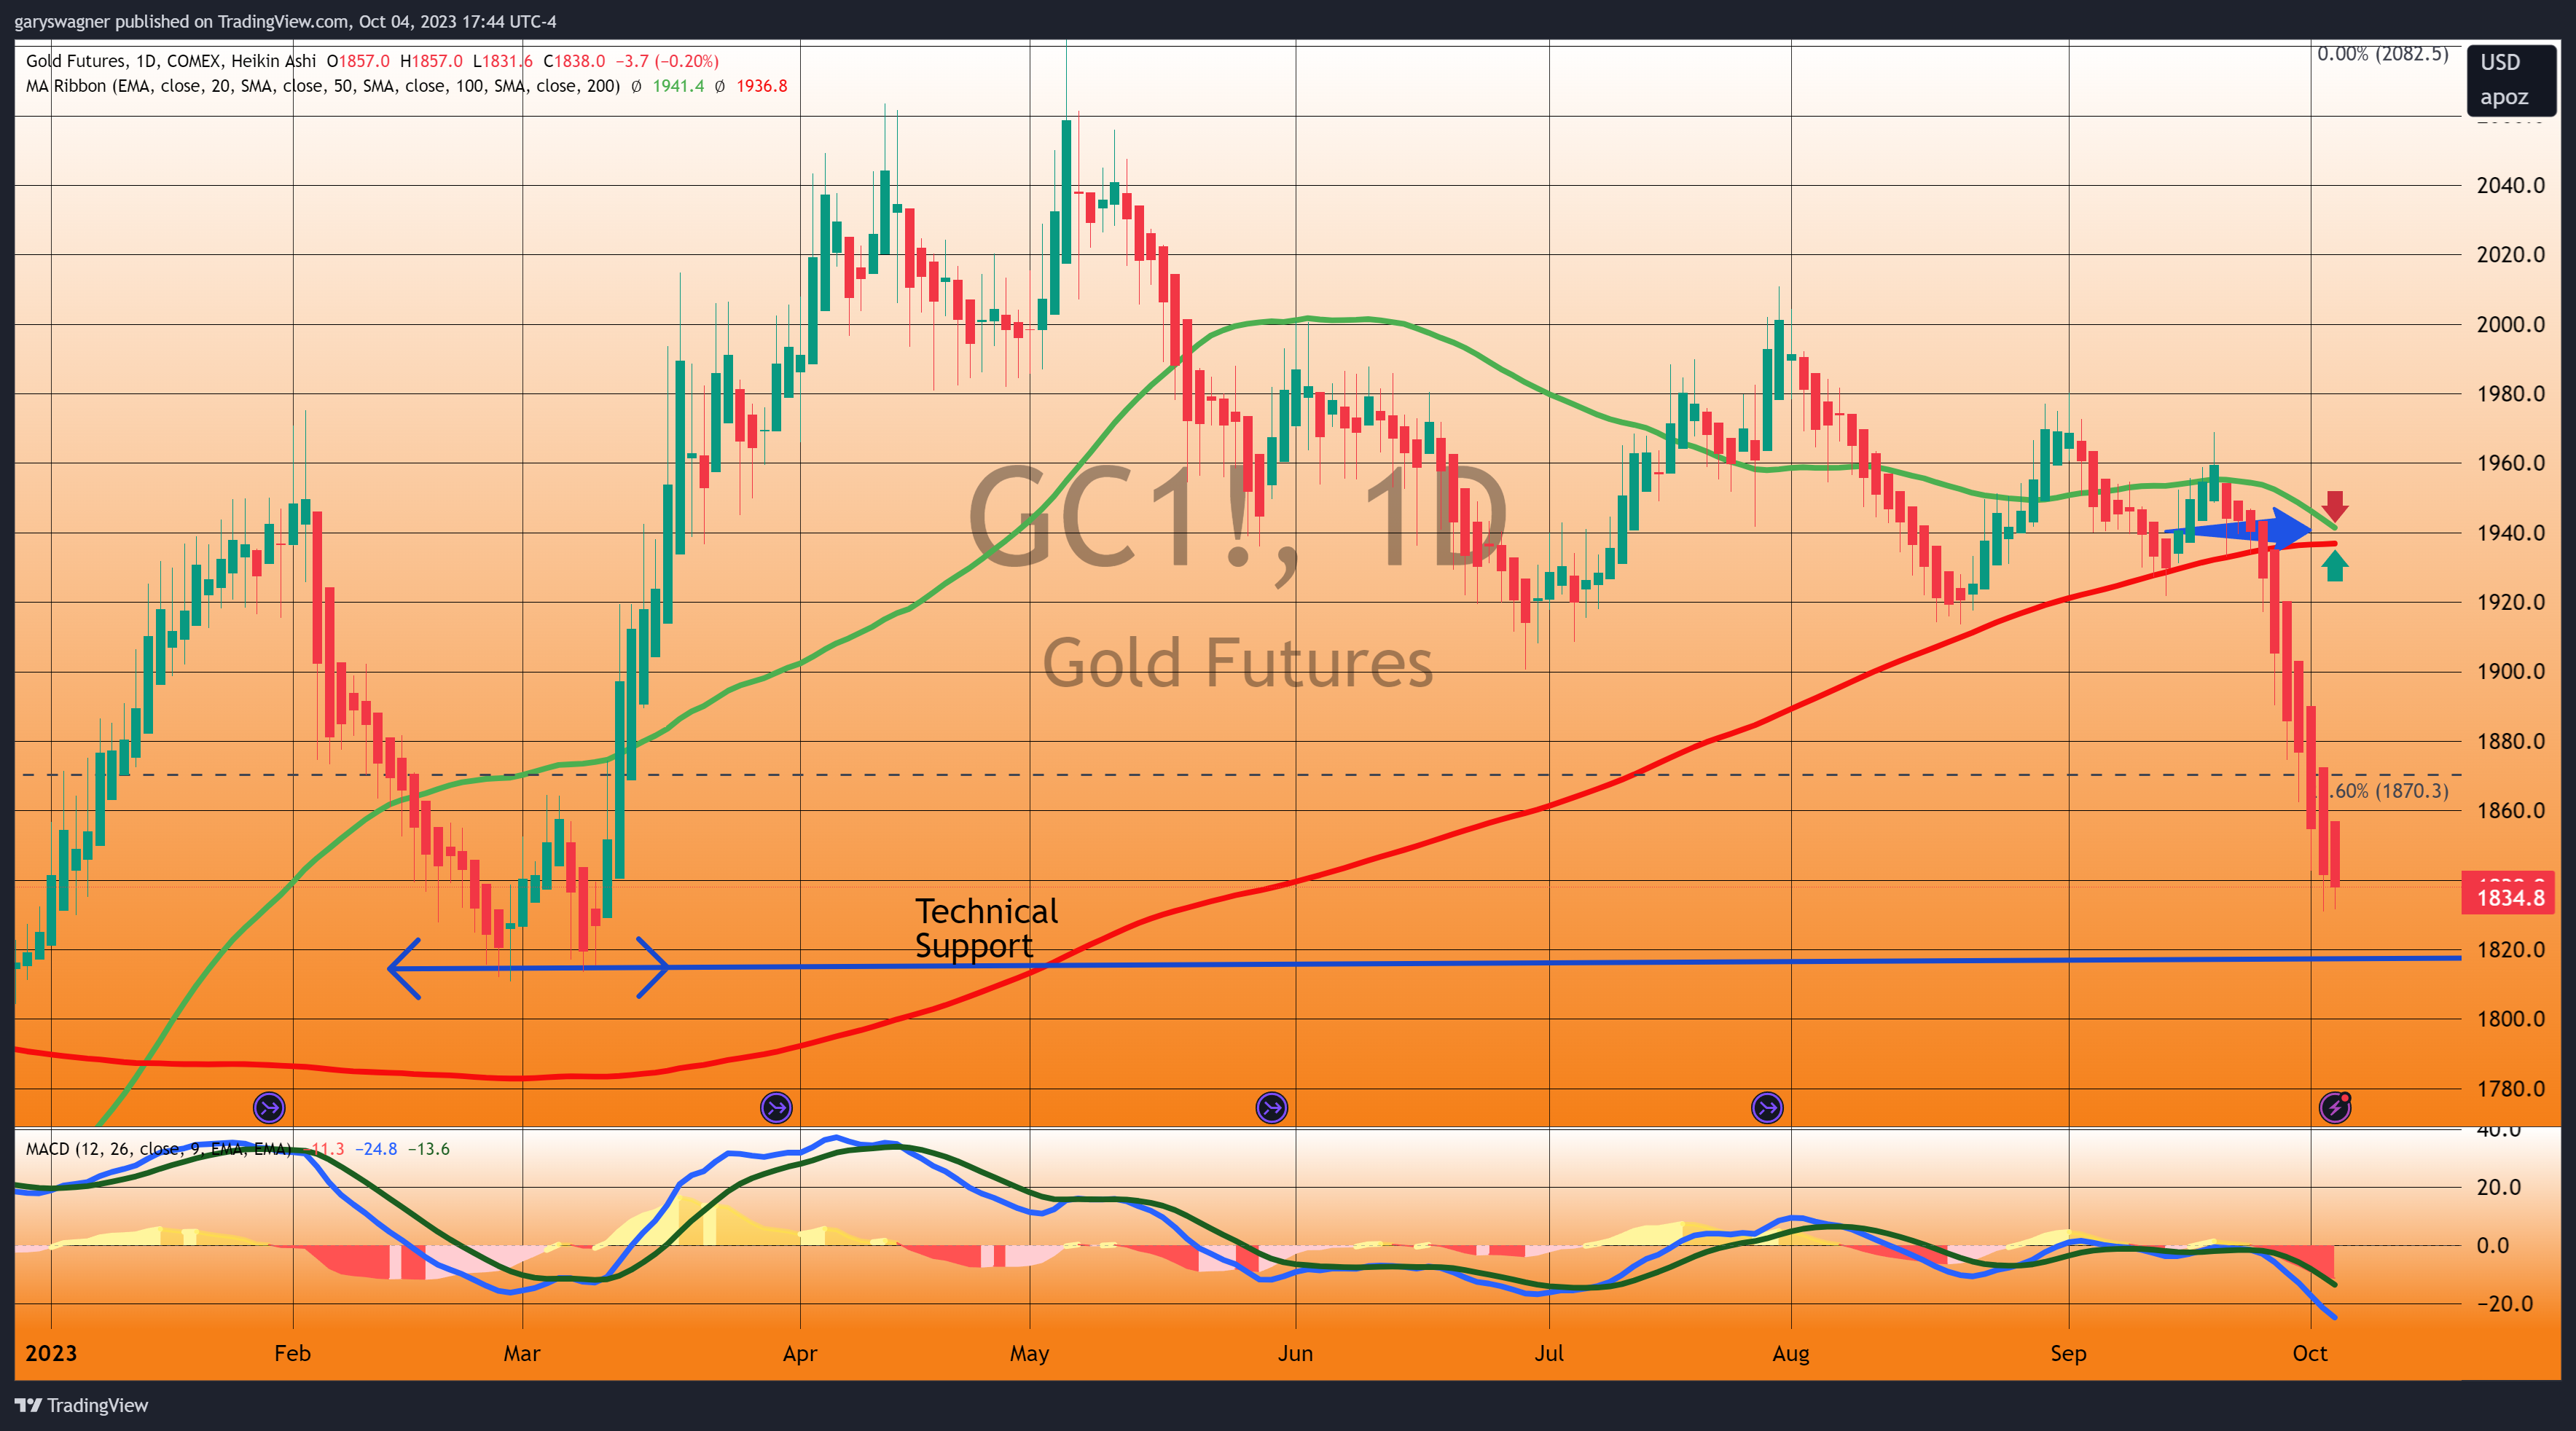
The daily chart above is in Heikin Ashi format. It is referred to as a Japanese average chart because of the technique used to create the candles. Unlike a candlestick chart which uses the true opening price, the Japanese average chart creates the open from the midpoint of the prior trading session. It is an exceptional chart style to indicate the strength of the trend, as well as pivot points. It also removes the noise as it creates a chart with prolonged cycles of all green or red.
The two primary features used to determine the strength of the trend are the body size (the larger the body the stronger the trend) and whether or not there is an absence of an upper wick in red candles, or a lower wick in green candles. In both cases, these wicks indicate the possibility that the trend is weakening.
The reason for this is the absence of an upper wick in a red candle means that at no point during the trading session did the current price trade above the prior candle’s midpoint. Lastly, it is a great tool to indicate a pivot point which will typically unfold as a color change (from red to green on a bullish pivot) and usually follows a decline to an extremely small body size.
Wishing you as always good trading,

Gary S. Wagner - Executive Producer