Gold declines after hitting new record high in the first hour of trading this week

Video section is only available for
PREMIUM MEMBERS
Gold futures basis, the most active February 2024 contract closed at $2091.70 on Friday, December 1. This after gold gained $35.60 or 1.73% opening at $2056.56 with a strong volume of 230,000 contracts. This would be the highest close for the February contract of gold futures. Trading would not resume until Australia’s open Monday morning, (Sunday in the United States).
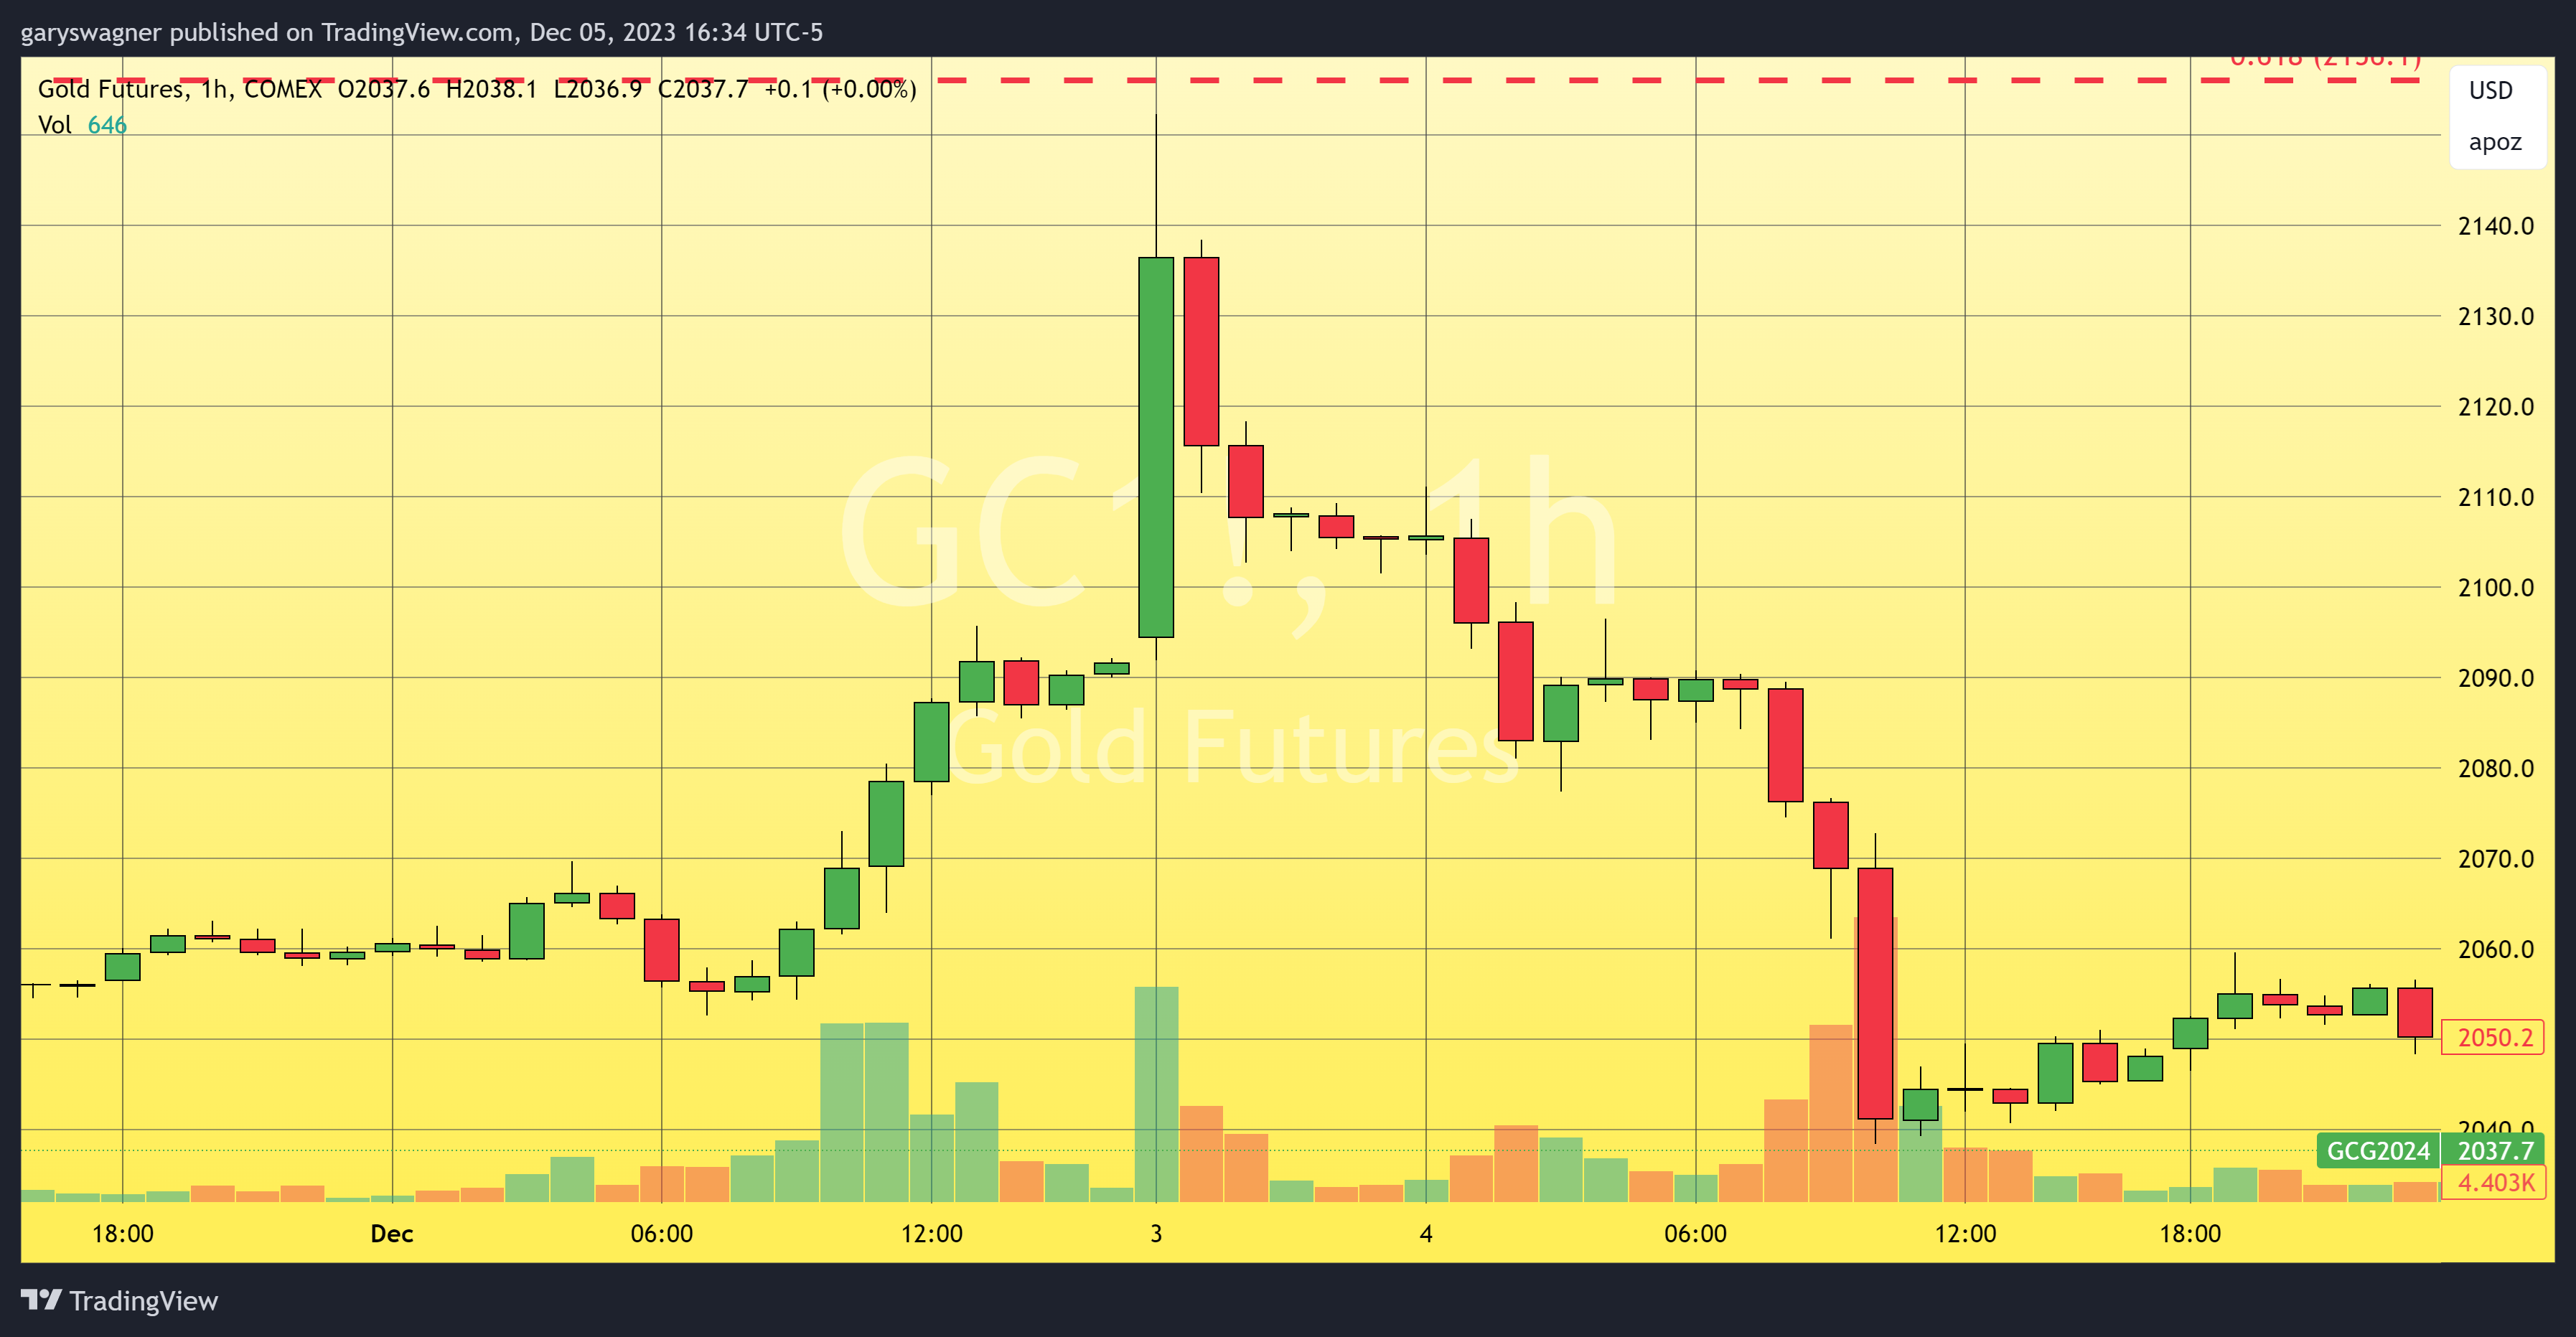
The chart above (chart 1) is a one-hour Japanese candlestick chart of gold futures. What occurred during the first hour of trading this week is still baffling with gold opening at $2094.40, a few dollars above Friday’s close. Within the first hour of trading, gold would gain an additional $44.80 taking gold to its record high of $2152.30. However, over the next eight hours, gold would erase all the gains it achieved and fell to below Friday’s closing price.
At 10:00 AM EST, one hour and 40 minutes after the official opening at 8:20 AM EST, gold futures would drop to $2041.20. In under 24 hours, traders witnessed one of the quickest whipsaws in gold pricing resulting in a retracement of over $100 per ounce from gold’s record high of $2152 to $2042.
As of 4:20 PM EST, gold futures continue to decline, currently down $10.60 with the most active February 2024 contract fixed at $2037.60. While today’s decline can be largely attributed to dollar strength, the wild price fluctuations that began Monday morning had moved gold to its highest value ever, only to retrace by over $100. This is perplexing as there was no major fundamental event or change that occurred during that time.
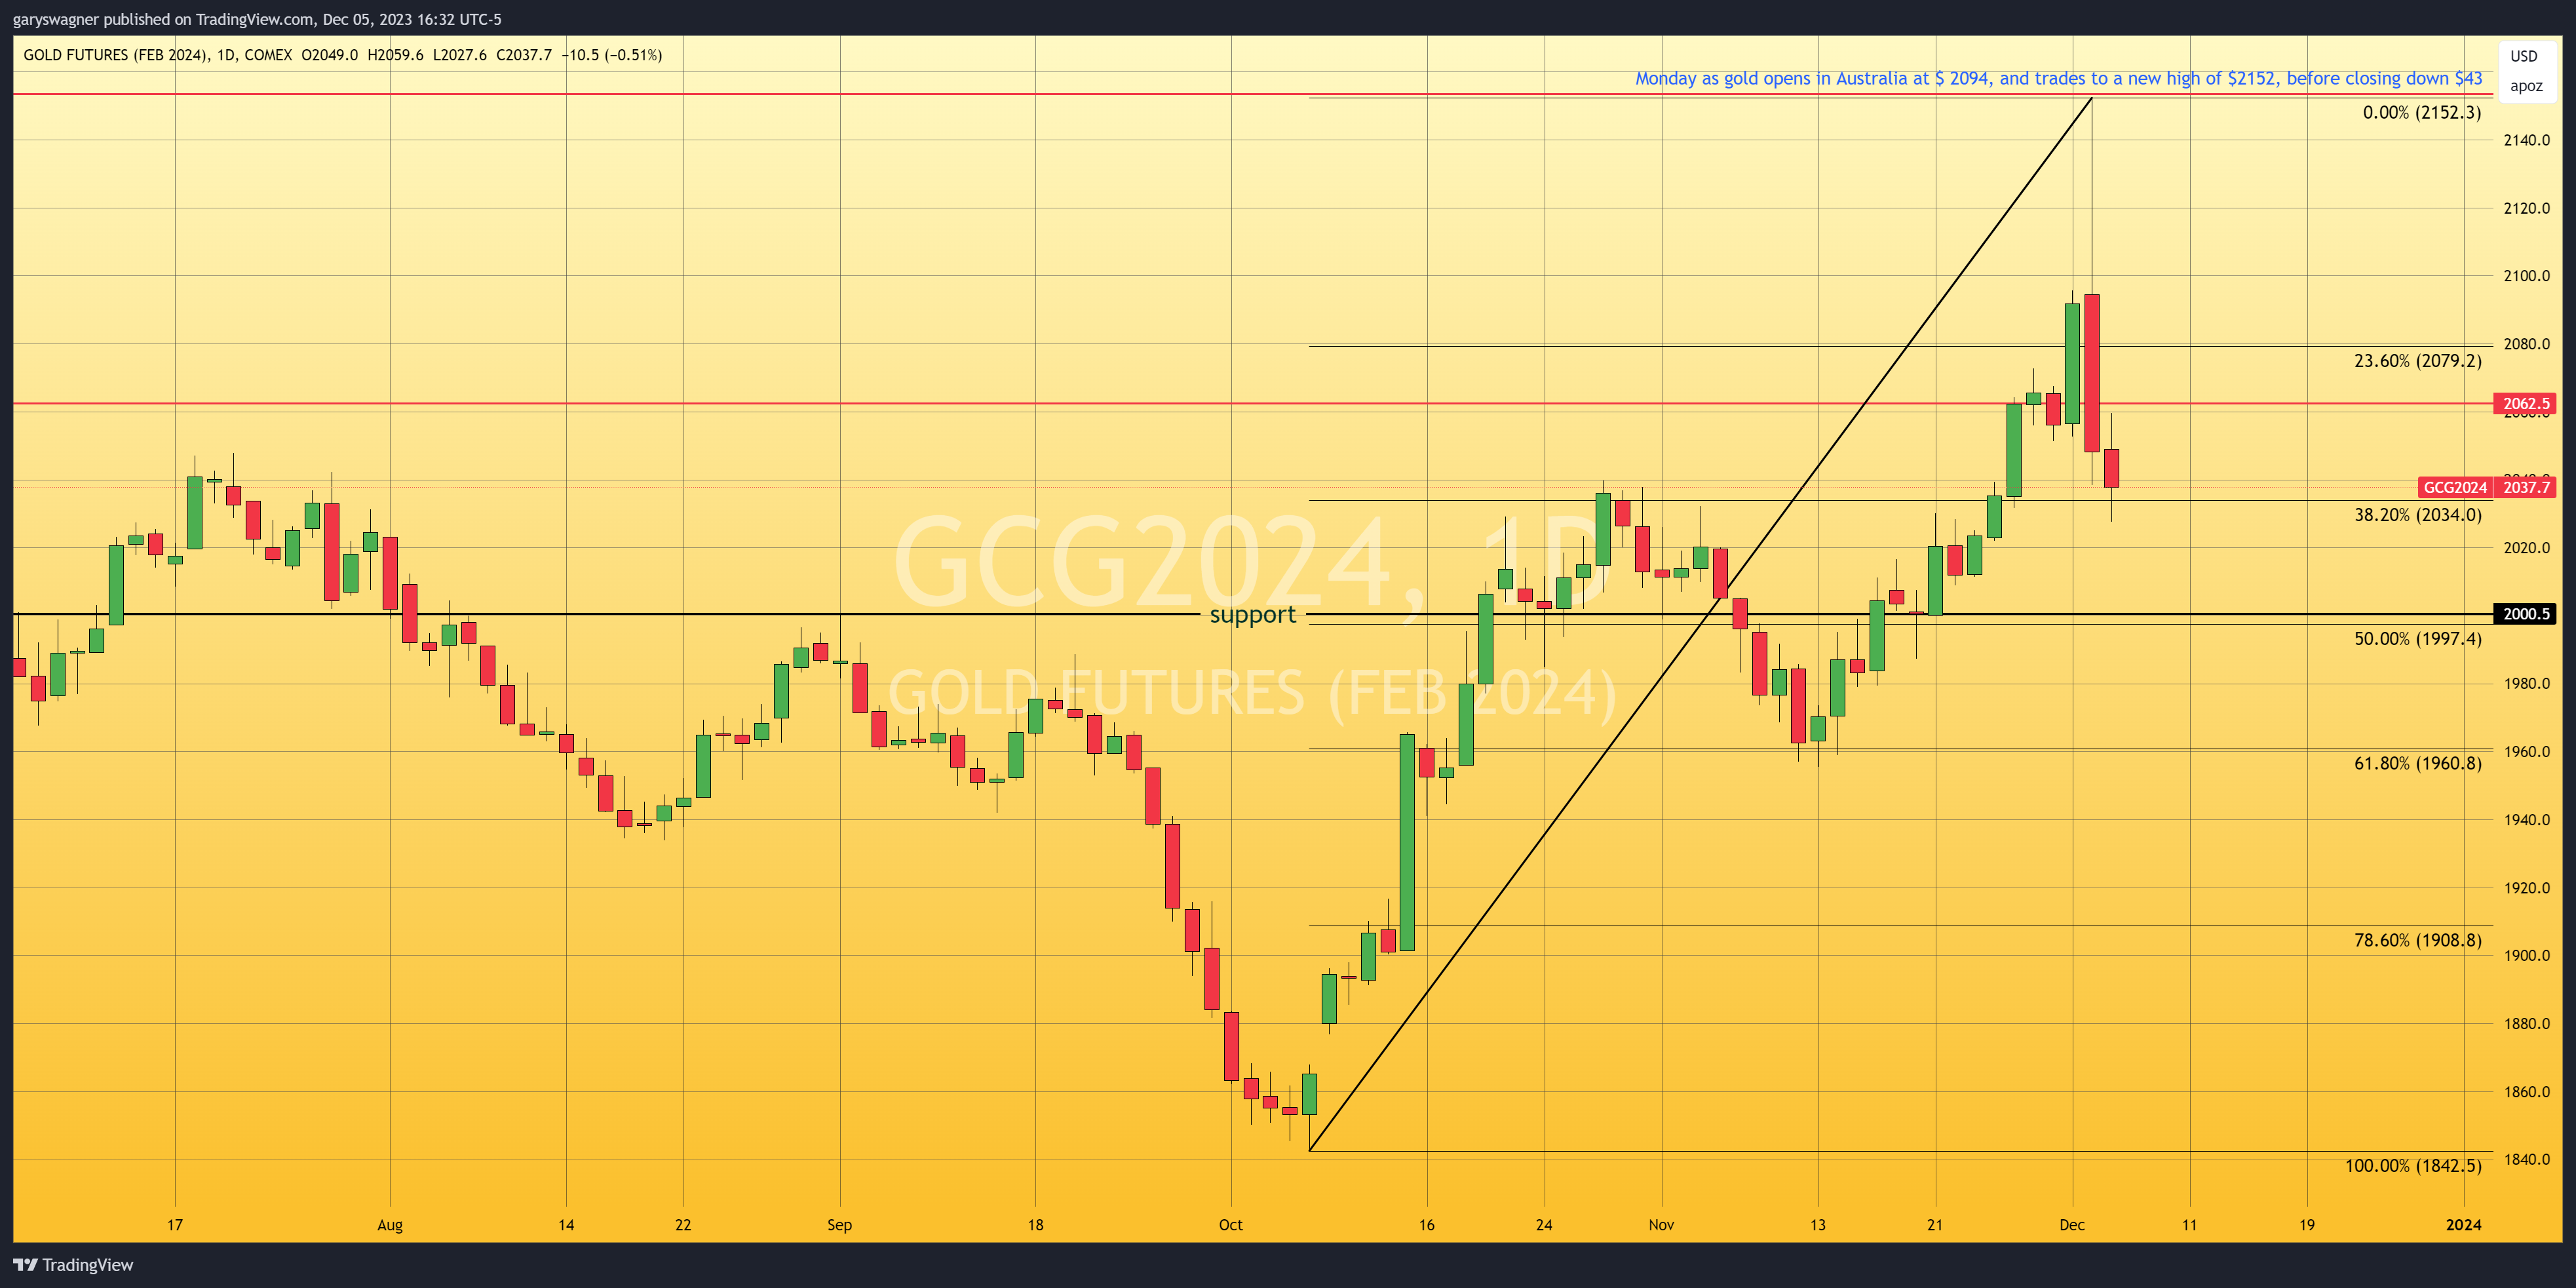
The chart above is a daily Japanese candlestick chart of gold futures. On a technical basis, major support is based upon the former level of major resistance, which occurs at $2000 per ounce. On the chart above, we have included a Fibonacci retracement. The data set begins at $1842.50, the low of Friday, October 6, and concludes at $2152.30 yesterday’s intraday high. The first level of support occurs at $2034 which corresponds to the 38.2% Fibonacci retracement of this data set. The 50% retracement occurs at $1997.40 which corresponds very closely to what we believe is major support at $2000.
Wishing you as always good trading,

Gary S. Wagner - Executive Producer