Gold has begun the final bullish impulse wave of a Grand Supercycle – Part II

Video section is only available for
PREMIUM MEMBERS
To the Western technical trader chart patterns are a major component used to predict future price movement over time. It is based upon the assumption that the study of historical price movements is a visual representation of market sentiment. Most importantly it is assumed that these patterns will repeat over time and thereby give traders an insight into potential future moves. Chart patterns are used to identify different market scenarios indicating an uptrend a downtrend or a market in consolidation, as well as price reversals.
Although RN Elliott was not the first market technician to create a theory about repeatable cycles found within financial markets, his theory is still used to this day. However, there are wild differences of opinion that his theory is valid. His theory is either highly admired or deeply questioned by market technicians.
Elliott Wave Theory
Elliott's wave theory is based upon the assumption that financial markets move in defined and repeatable patterns. A full wave count, in its most forms, requires a total of eight waves. The example presented here is for a bullish wave count and contains eight waves. The count will repeat itself if market sentiment remains bullish
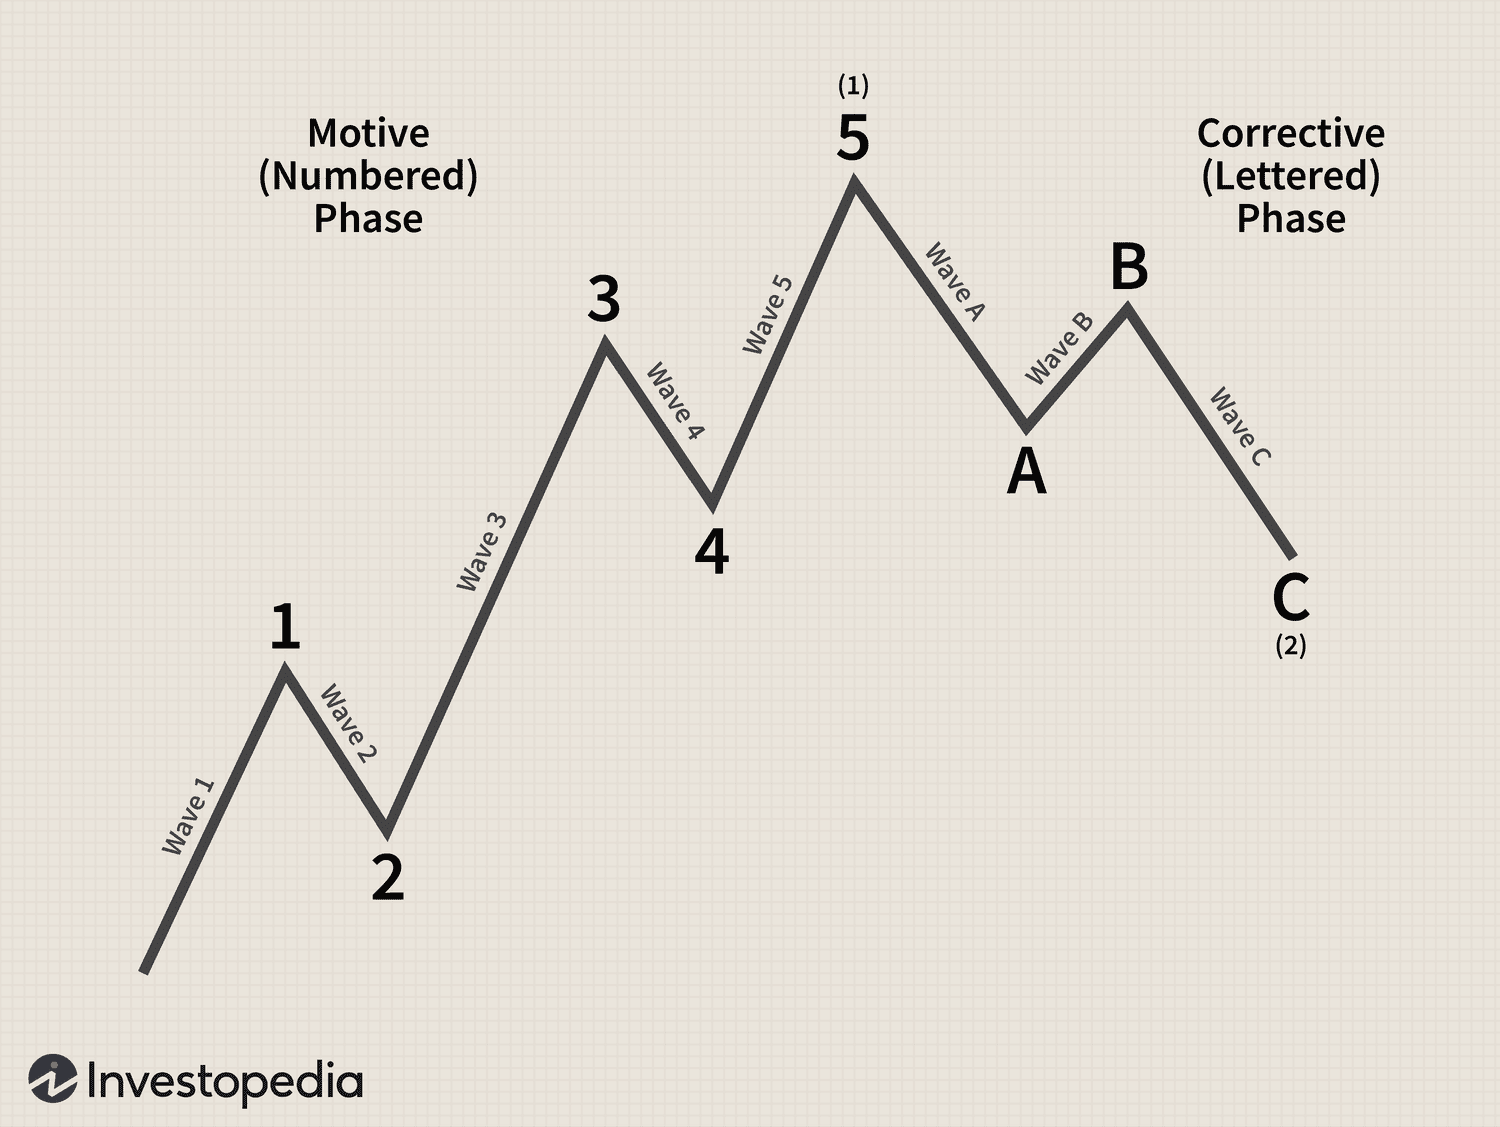
Waves one through five are labeled the motive phase containing three impulse waves. Waves one, three, and five move in the primary trend direction. Waves two and four are labeled corrective waves and move in the opposite direction of the primary trend. A corrective phase will begin immediately following the conclusion of the motive phase. The corrective phase in its most simplistic model will contain three basic waves (A, B, and C)
The Grand Supercycle
Elliott wave cycles are intrinsically fractal beginning with the largest cycle that he has labeled a Grand Supercycle. The Grand Supercycle takes place over decades and can take 60 or more years to complete. This cycle is subdivided into the motive phase of five waves labeled a Supercycle.

Fractal Nature of Elliot Waves. All cycles can be subdivided into smaller sub-waves. This means that each wave is made up of self-similar sub-waves that also have some relevance in the market. In other words, the same 1-2-3-4-5-a-b-c pattern that makes up the basic Elliott Wave can be seen in some form or fashion as you zoom in and zoom out.
According to physicsworld.com., Physicists believe that fractals also exist in the quantum world, and now a group of researchers in the US has shown that this is indeed the case.
We believe that gold has been in a Supercycle that began roughly in 1973 and continues today. This model is in its most simplistic format.
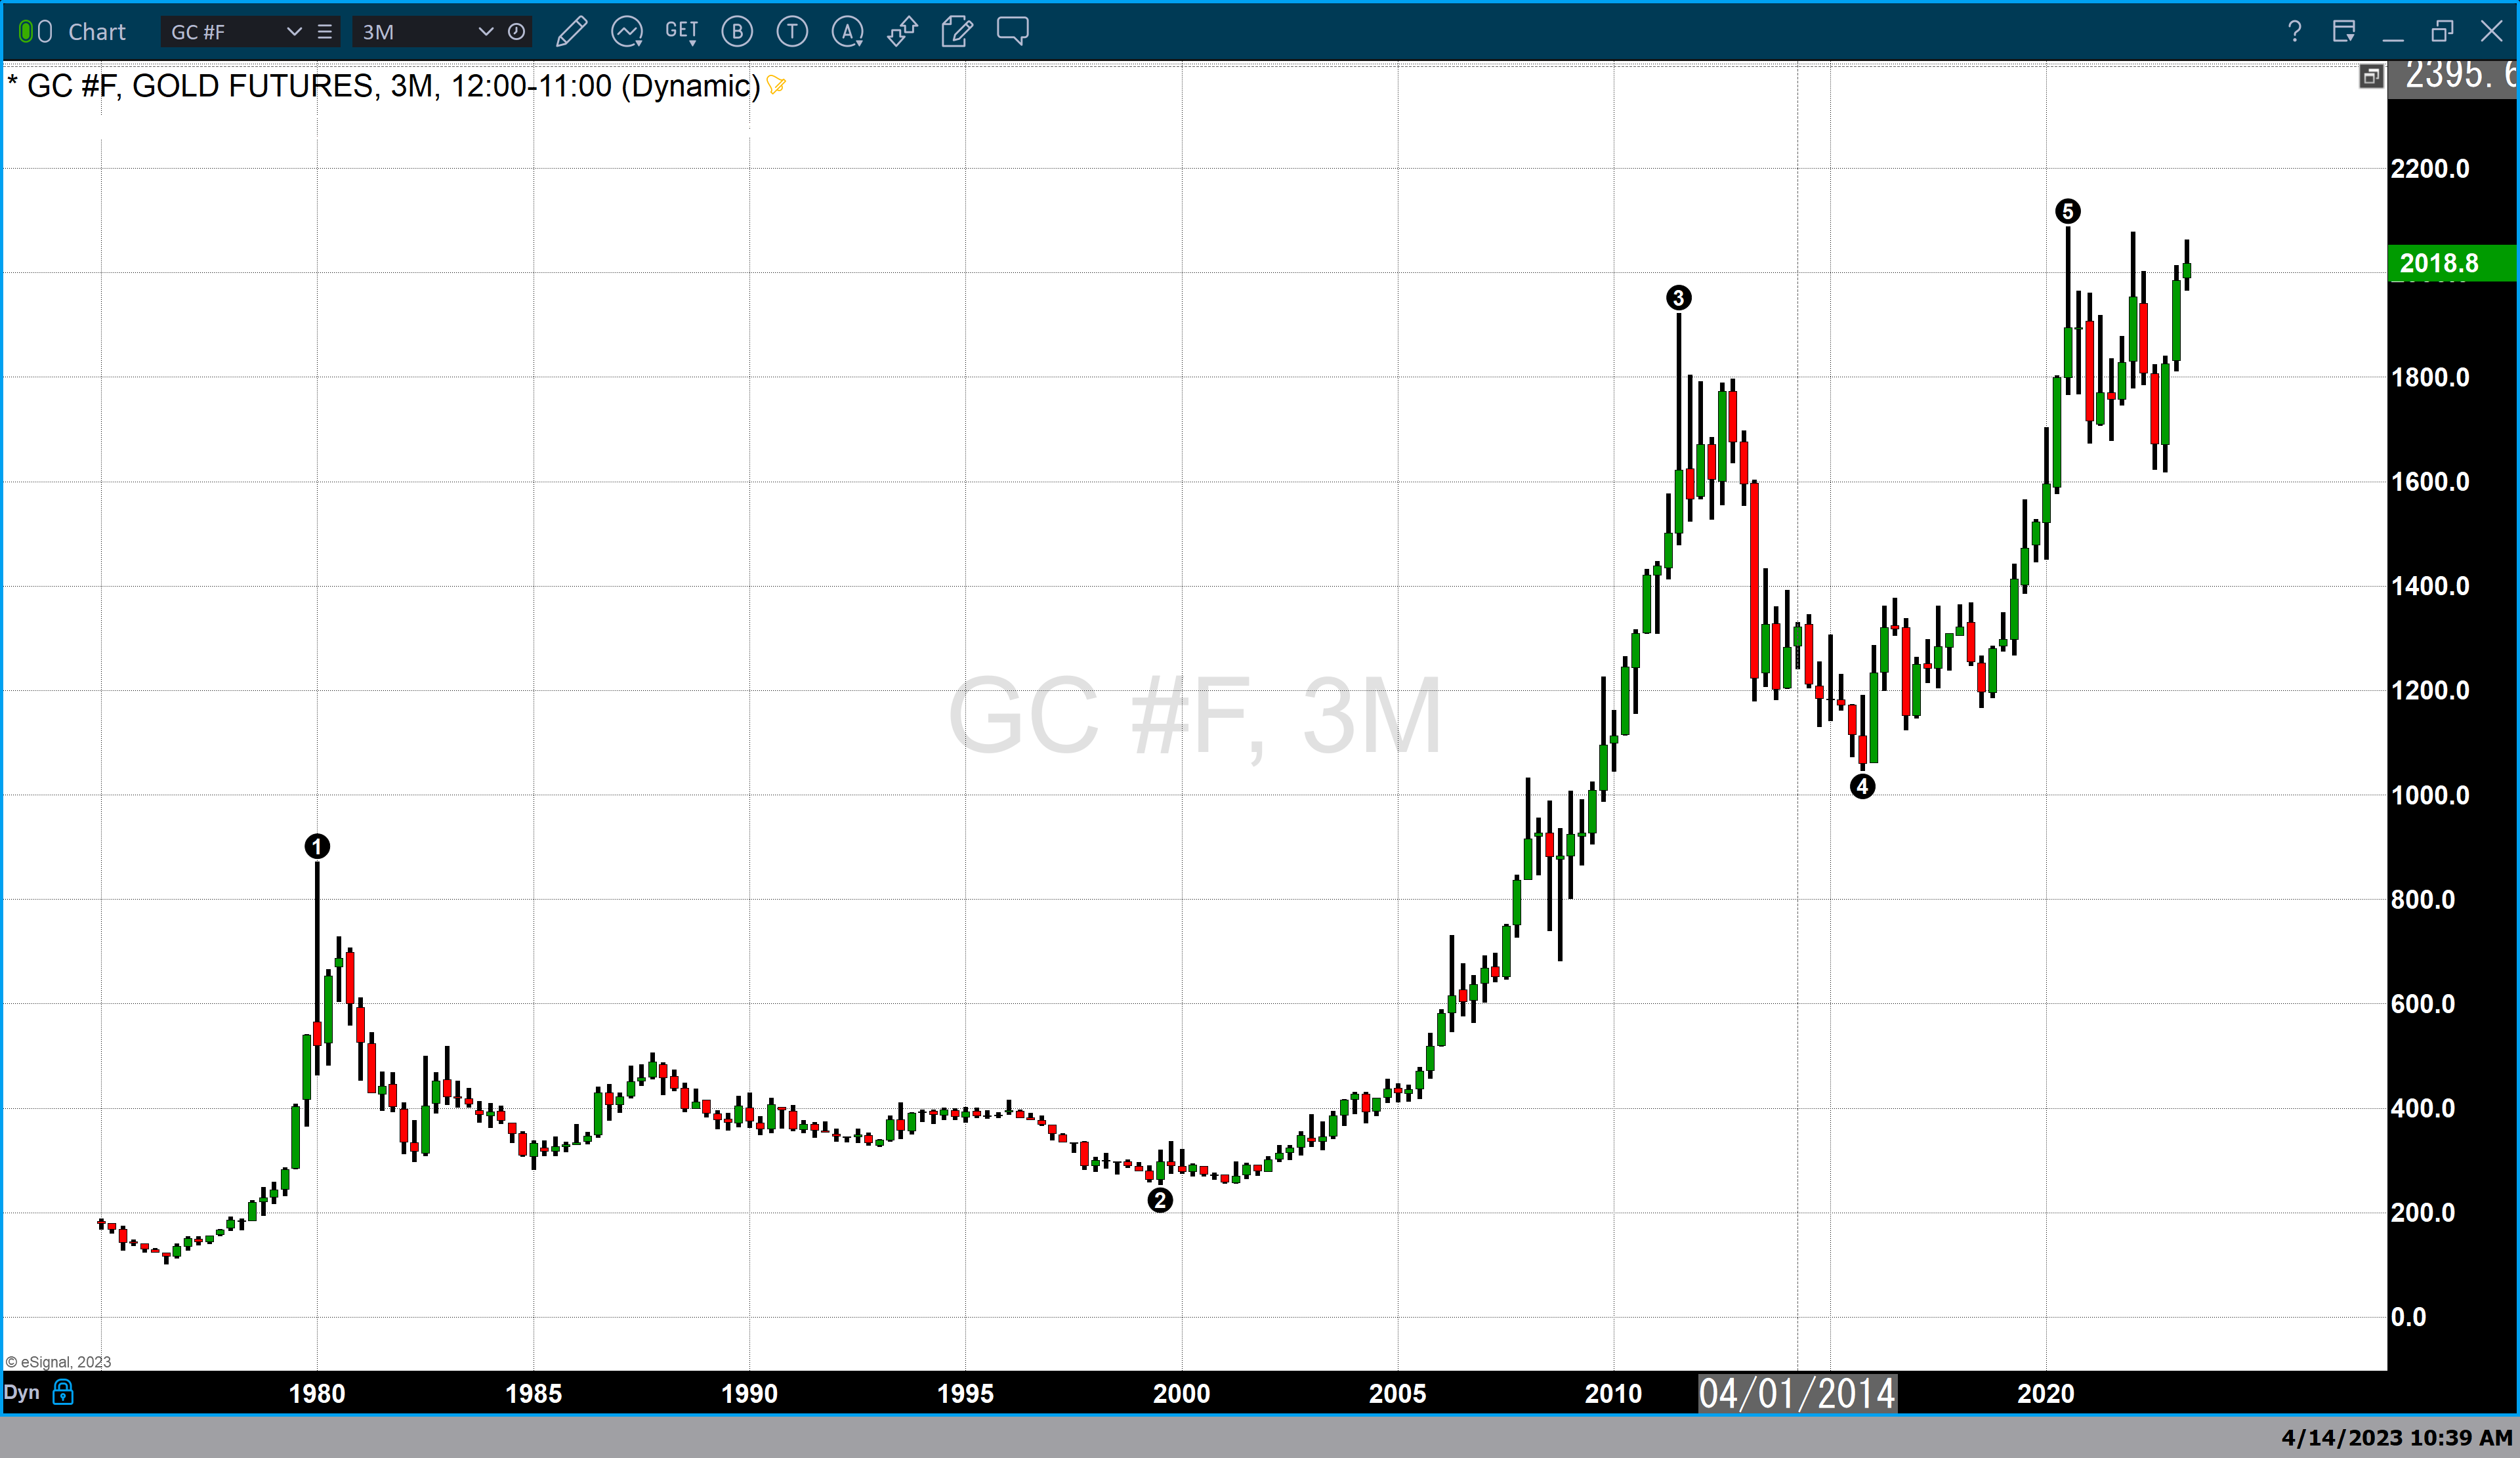
The chart above is a standard Japanese candlestick chart in which each candle represents three months. It begins in 1975 a few years after President Nixon took the United States completely off of the gold standard. During the early 70s gold was trading between 100 and $200 per ounce. However, once the gold standard was abolished gold prices spiked to approximately $1863 by 1980 completing a supercycle the first wave of the eight waves need to complete a full Grand Supercycle. This Supercycle wave took approximately five years to complete.
Wave two was a corrective Supercycle wave that would take approximately 20 years to complete. This corrective wave took gold prices from the high of $863 to approximately $259
In 2000 the largest impulse wave, wave three began with gold at approximately $250 per ounce and concluded at the highest value gold had achieved up to this point above $1900 per ounce, taking just under 12 years to complete. What followed was a multiyear correction labeled way for. This moved gold prices from above $1900.to $1020 per ounce at the end of 2015, and the beginning of 2016.
In 2016 the multi-year correction had concluded and a final impulse wave began which will complete the motive phase (waves one through five). We believe that the current rally is part of a Supercycle fifth wave that has yet to conclude.
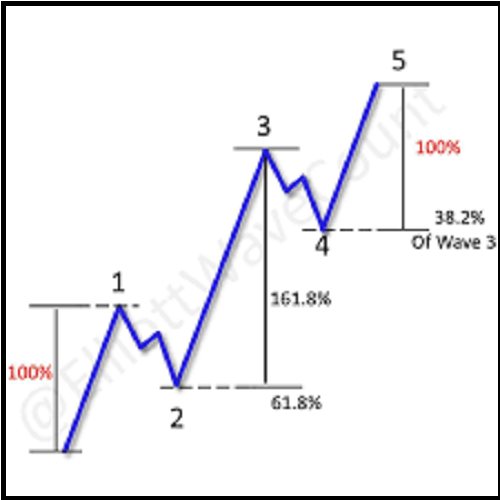
Yesterday we projected where gold prices could go once this wave concludes. We will present our final installment, part three next week in which we will explain how these projections are created using Fibonacci retracements combined with Fibonacci extensions and basic rules of Elliott Wave theory.
Wishing you as always good trading,

Gary S. Wagner - Executive Producer