Higher U.S. Bond yields and dollar strength pressure gold lower

Video section is only available for
PREMIUM MEMBERS
Gold continues to trade under pressure trading dramatically lower for the last seven consecutive days. Today gold traded to a low of $1830.90, a low not witnessed in gold futures since Thursday, March 9.
The force moving gold lower is the Federal Reserve’s resolve to keep interest rates elevated for longer with the possibility of one more quarter percent rate cut this year. However, what has crippled gold immensely is the fact that the Federal Reserve has revised its monetary policy to reduce the rate cuts next year in half. In June, the Federal Reserve’s dot plot was projecting a total of four quarter percent rate cuts which would bring down the Fed funds rate by a full percent.
The most recent dot plot released at the September FOMC meeting had revised the number of rate cuts next year cutting them in half. Currently, the Federal Reserve is projecting that it will cut rates by ¼% twice rather than four times. If the Federal Reserve does reduce the number of rate cuts, only initiating a total of a ½% cut it would mean that the Fed funds rates would remain elevated above 5% throughout 2024.
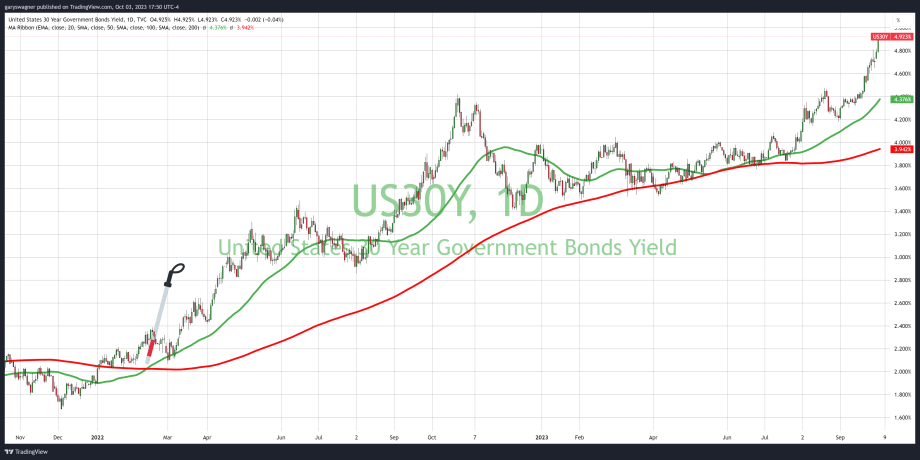
The chart above is a daily Japanese candlestick chart of 30-year U.S. bonds. The major move witnessed today increased the yield from just under 4.8% to 4.923%. Considering that the thirty-year bond was yielding just under 3.9% at the beginning of July the yield of this U.S. Treasury has gained roughly 1% in the last three months. The simple 50-day moving average has been in essence above the long-term 200-day simple moving average since Friday, February 11. Except for a brief time at the end of April and the beginning of June when both the 50-day and 200-day were at the same price.
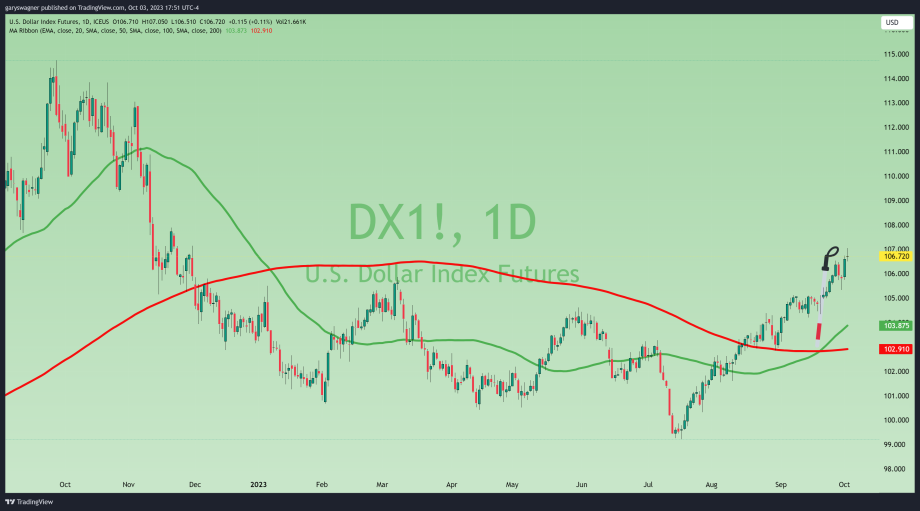
The chart above is a daily Japanese candlestick chart of the U.S. dollar index. The U.S. dollar has also had a substantial gain and is currently at its highest value since November of last year. Today the dollar opened at 106.71 traded to a high of 107.05 and is currently fixed at 106.72. The dollar index was trading below 100 at 99.51 on Thursday, July 13. Recently on Tuesday, September 19, the simple 50-day moving average crossed above the longer-term 200-day moving average creating a golden cross
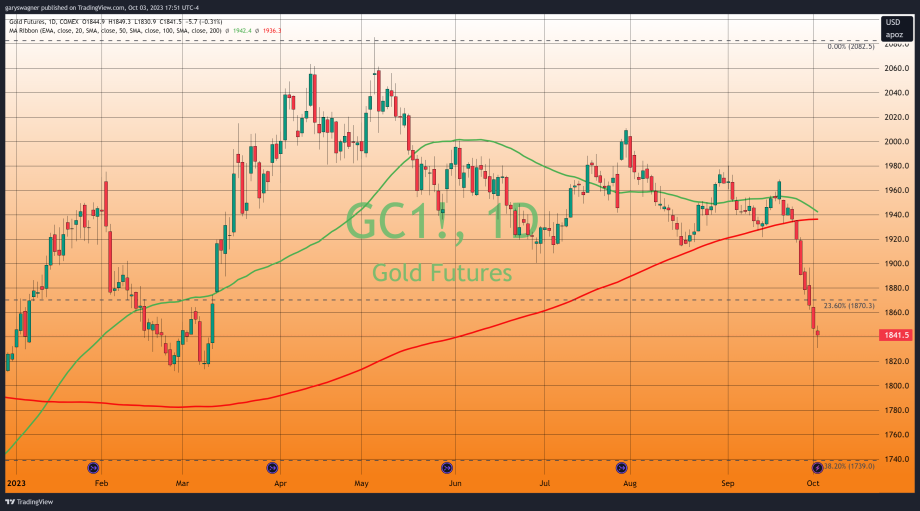
The chart above is a daily Japanese candlestick chart of gold futures. Currently, it appears it is highly likely that the 50-day simple moving average will cross below the longer-term 200-day simple moving average. Currently, the 50-day moving average is fixed at $1942.40, and the 200-day is fixed at $1936.30. Gold only has to decline a little lower for a death cross to emerge. As of 5:54 PM EDT, gold futures basis the most active December contract is trading at $1841.50 after factoring in today’s decline of $5.70.
As long as the dollar strengthens and yields on U.S. Treasuries continue to increase, gold will trade under pressure. On a technical basis, there is no support for the December contract until approximately $1817 which matches the two lows that occurred during the end of February and the beginning of March.
For those who would like more information simply use this link.
Wishing you as always good trading,

Gary S. Wagner - Executive Producer


