Sellers dominate gold futures and spot pricing but dollar weakness overcomes losses

Video section is only available for
PREMIUM MEMBERS
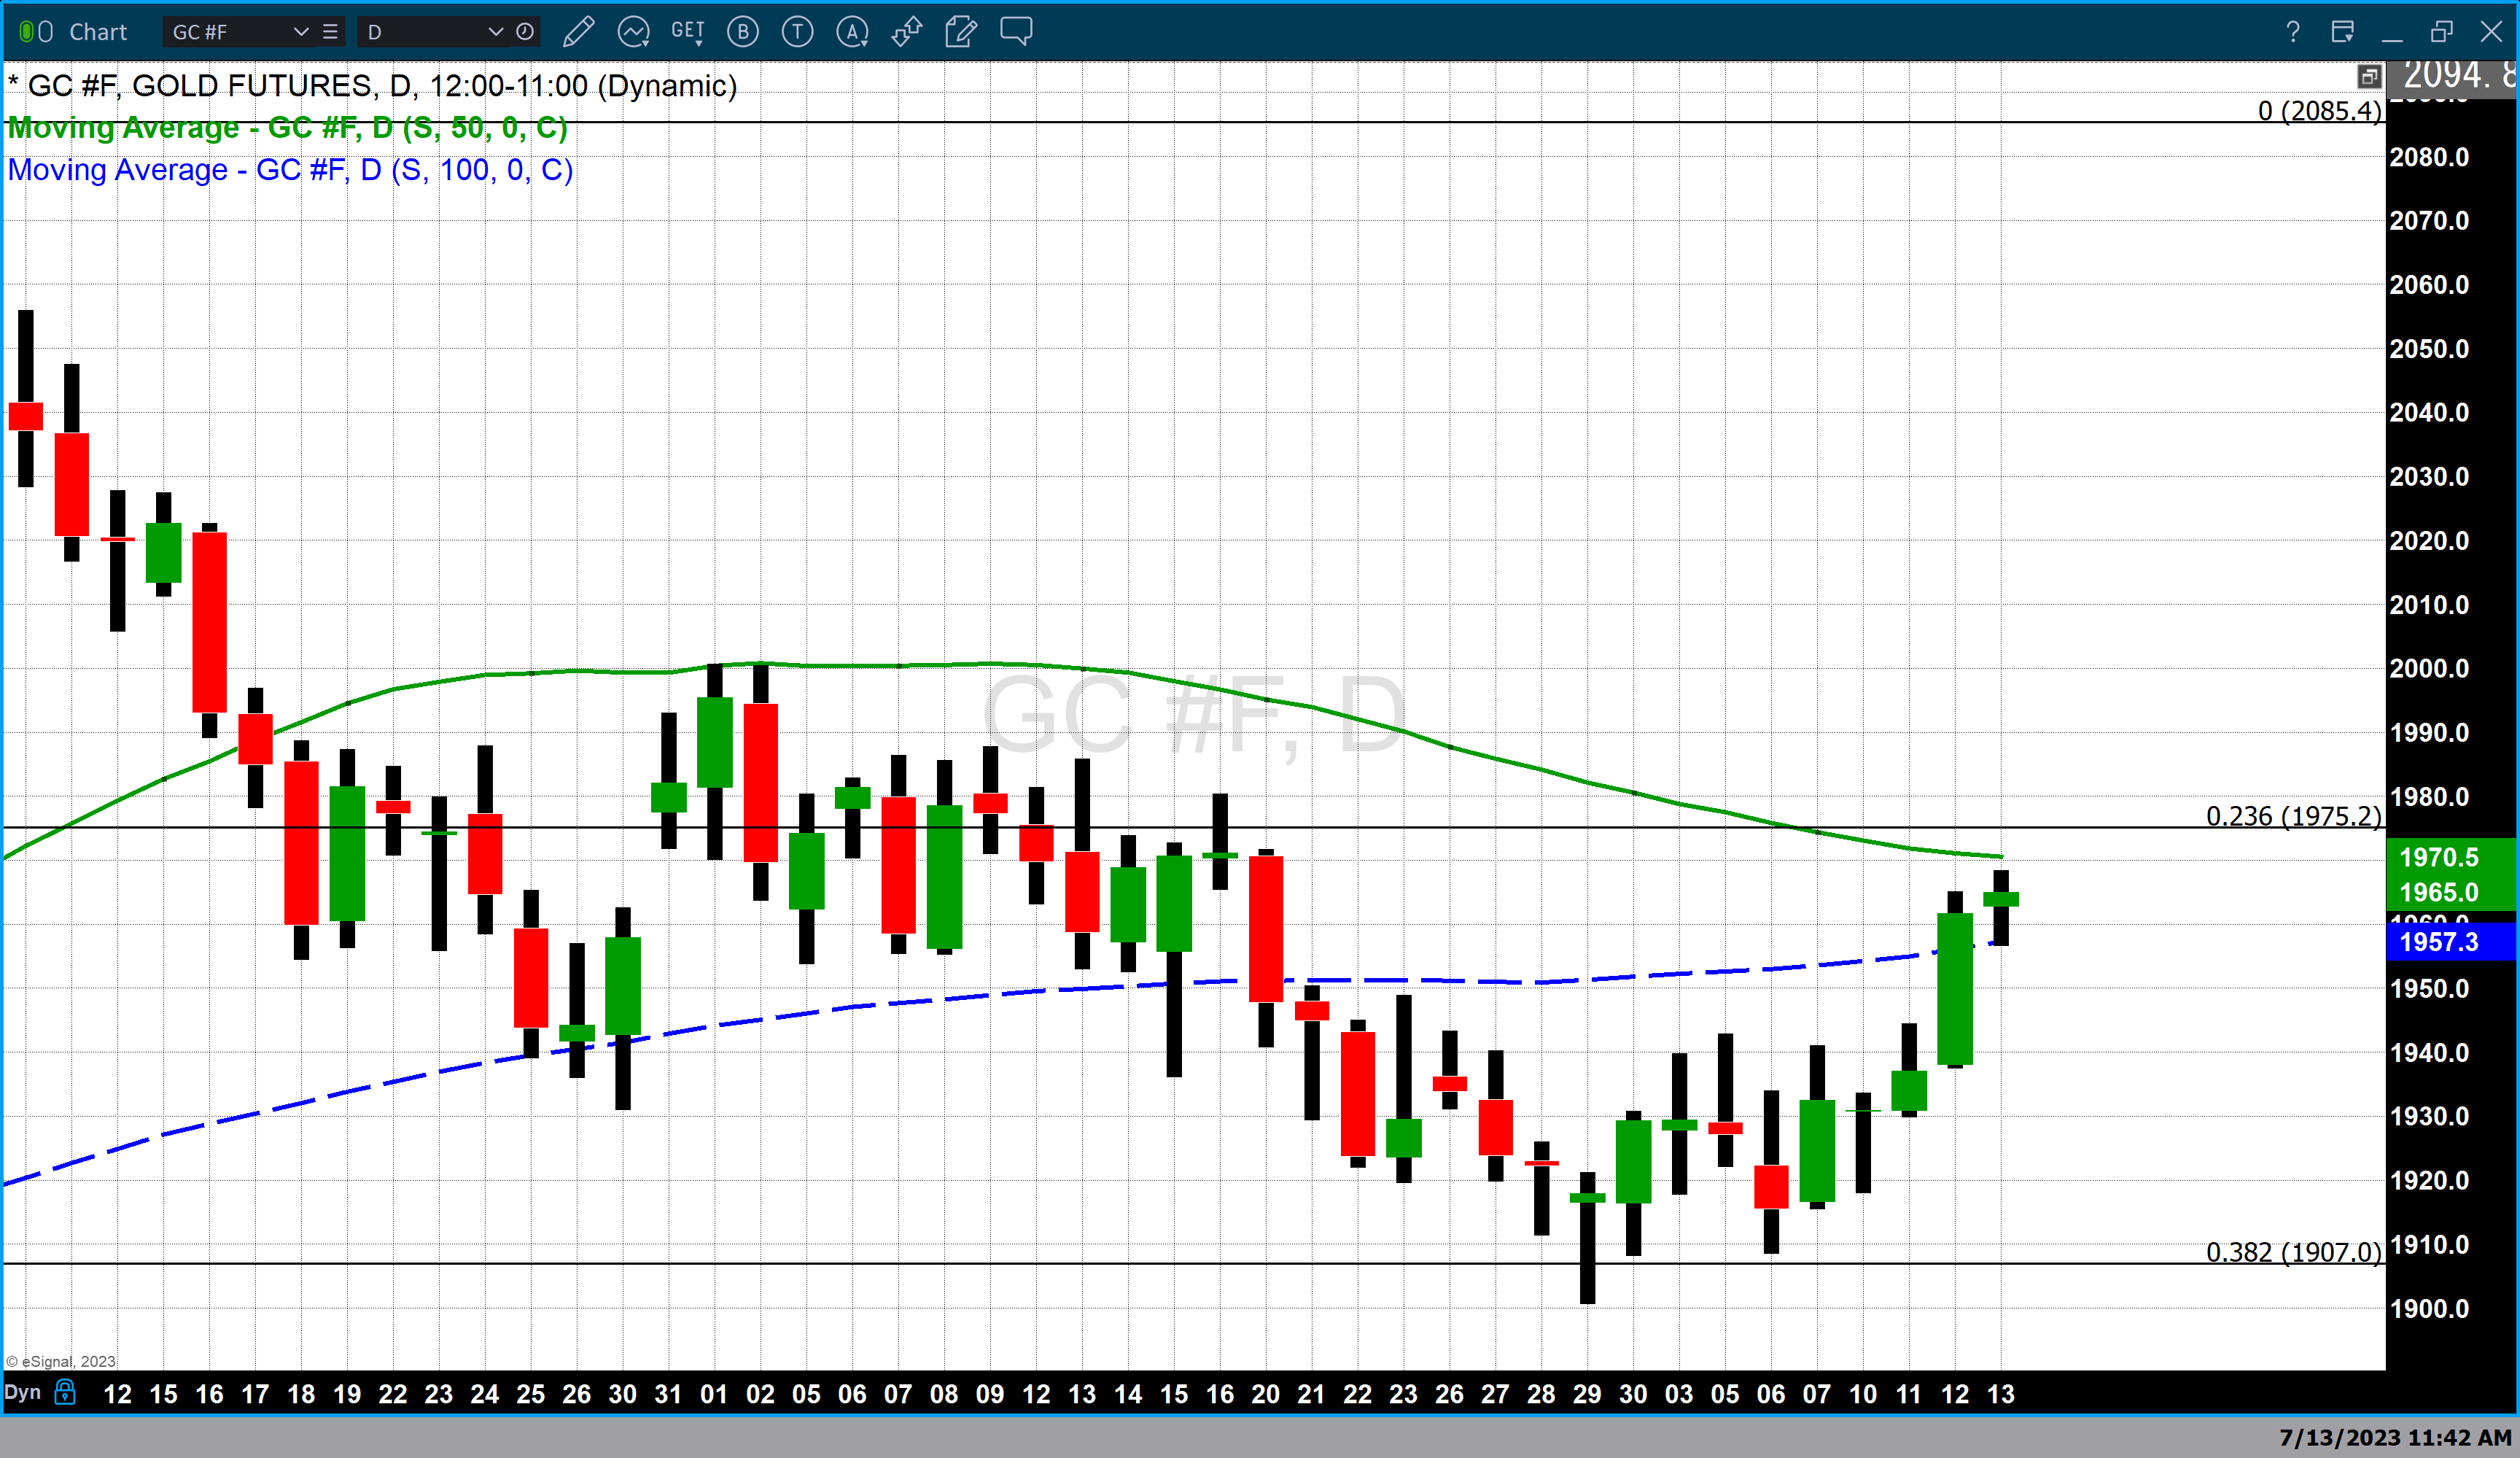
On the surface, traders are witnessing higher pricing in physical and forex gold, as well as gold futures in trading today. Gold futures basis the most active August contract is currently up $3.30 or 0.17%, spot gold is currently fixed at $1960 up $2.70, and Forex gold is currently up four dollars or 0.20% and fixed at $1960.40.
But as it has been for the last six consecutive trading days, since July 6, it is been severe and extreme selling pressure in the dollar index that has made the most significant impact on daily price changes. Gold is paired against the dollar which means that any price change is a combination of dollar strength or weakness as well as bullish or bearish market sentiment for gold.
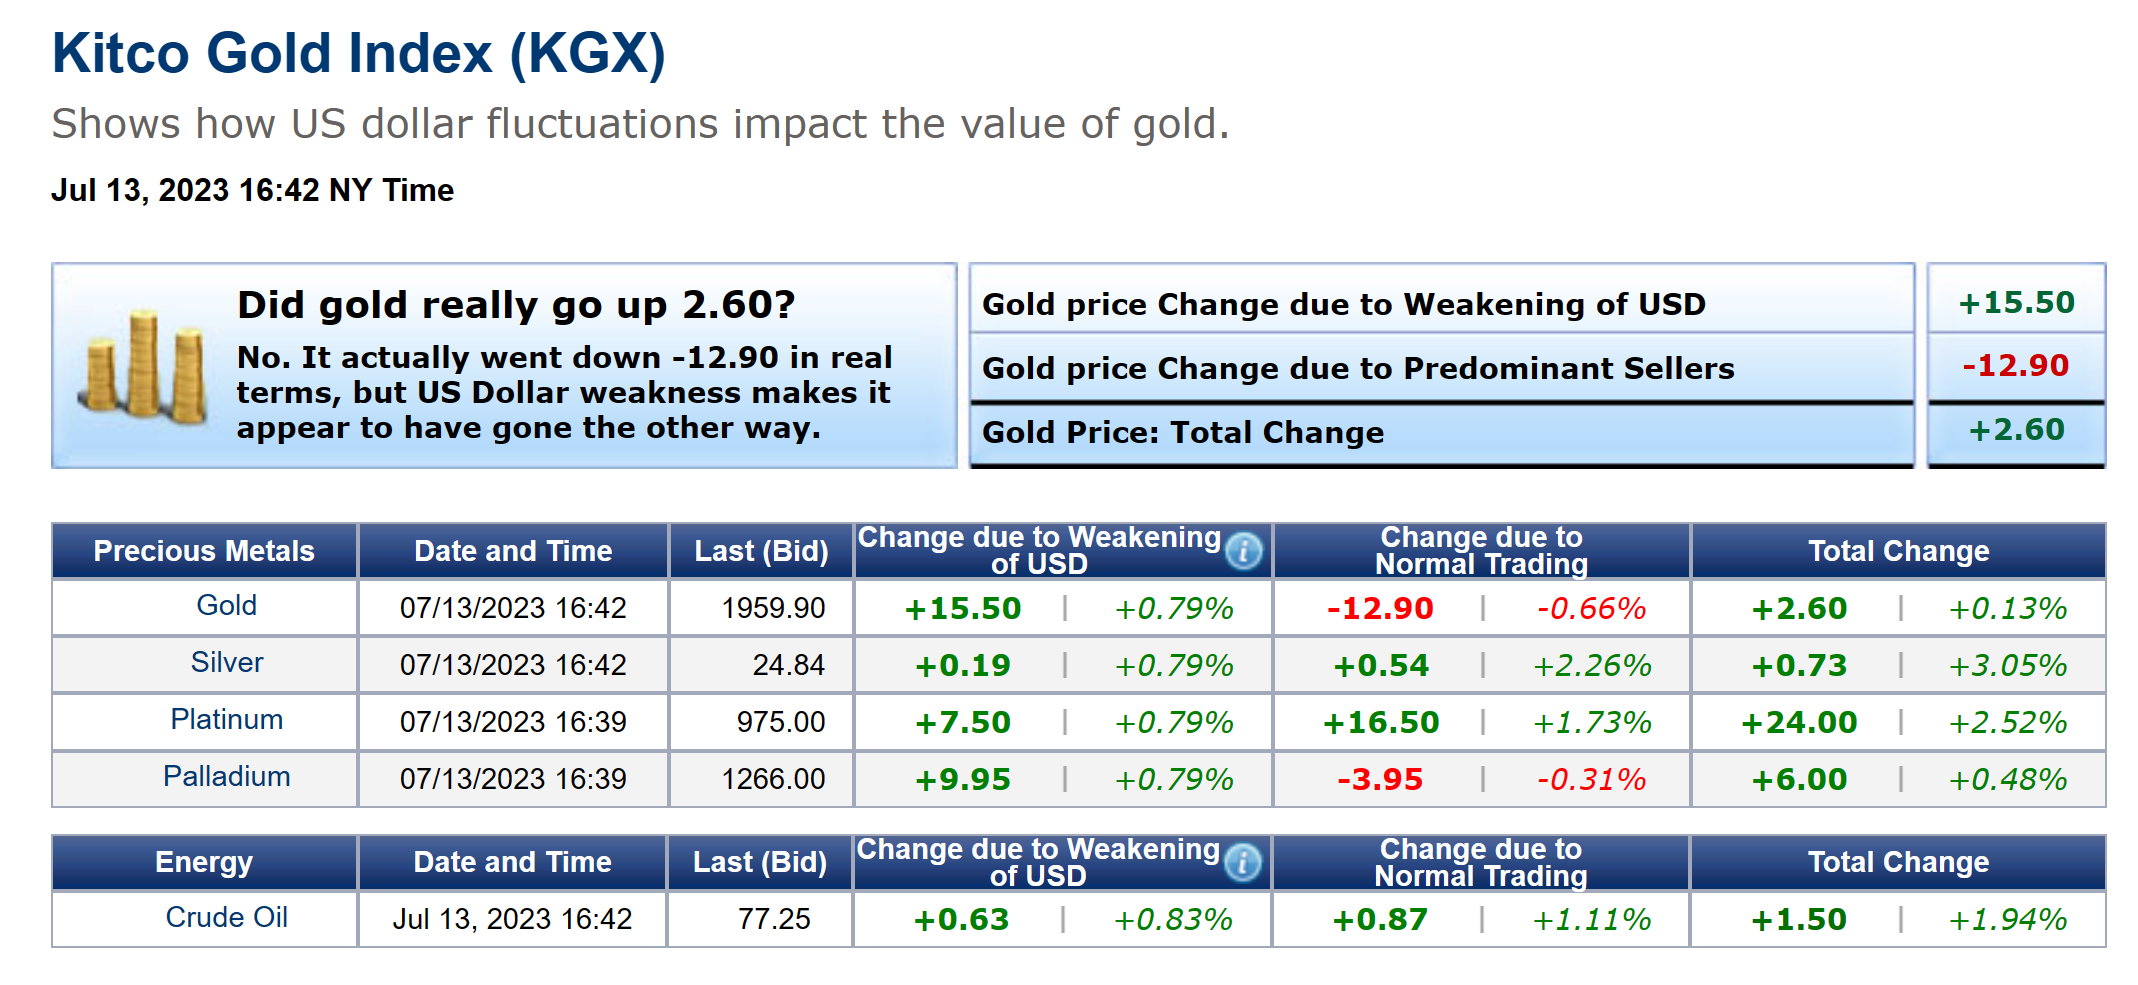
The image above is a screen-print of the Kitco Gold Index (KGX) taken at 4:42 PM EDT today. It fixes spot gold at $1959.90 after factoring in today’s gain of $2.60. On closer inspection dollar weakness added $15.50 of value and normal trading resulted in a $12.90 sent decline resulting in today’s change.
The dollar has had another day of deep declines. Currently, the dollar is down 0.758% taking the index to 99.435. The dollar index opened at approximately 103 a week ago Thursday, July 6. During each trading session that followed the dollar closed below both its opening price and the closing price of the prior day. The chart below is a daily candlestick chart of the dollar index. It is the best way to visually express the carnage witnessed over this last week with the dollar index losing over 3% of value when compared to the basket of currencies it is traded against.

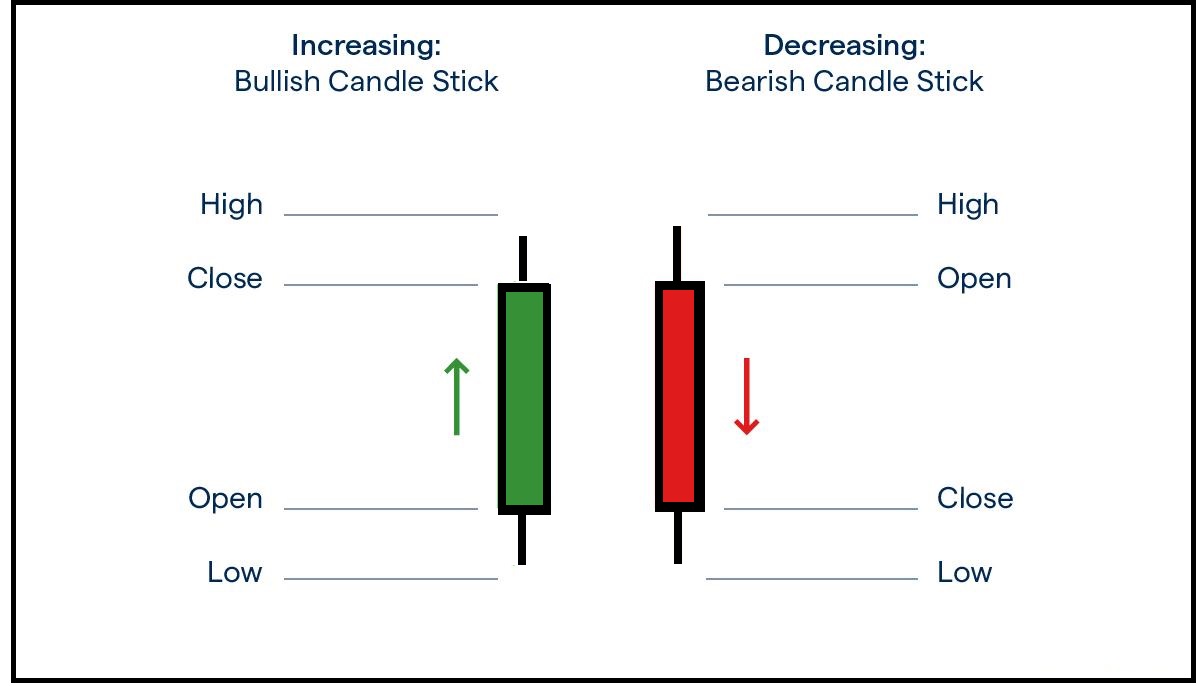
Japanese candlesticks draw a rectangle around the open and closing price and then color them according to whether prices closed above or below the open. When the dollar closes below its opening price it creates a red real body, when it closes above the open it creates a green real body. Large-bodied Japanese candlesticks are significant in that they indicate a deep price advance or decline from the opening price. The image below illustrates how Japanese candlesticks look when prices close above or below the open.
Dollar weakness has muted real gains during trading sessions in which market participants were actively bidding gold higher, it has also muted and lessened the gains during trading sessions in which buyers were more prevalent than sellers in gold. It is almost a certainty that the dollar index will finish with the second consecutive weekly decline. Even with one trading day left in the week the weekly decline in the dollar is so deep that the last time we have seen such a strong weekly decline was the week of November 7, 2022.
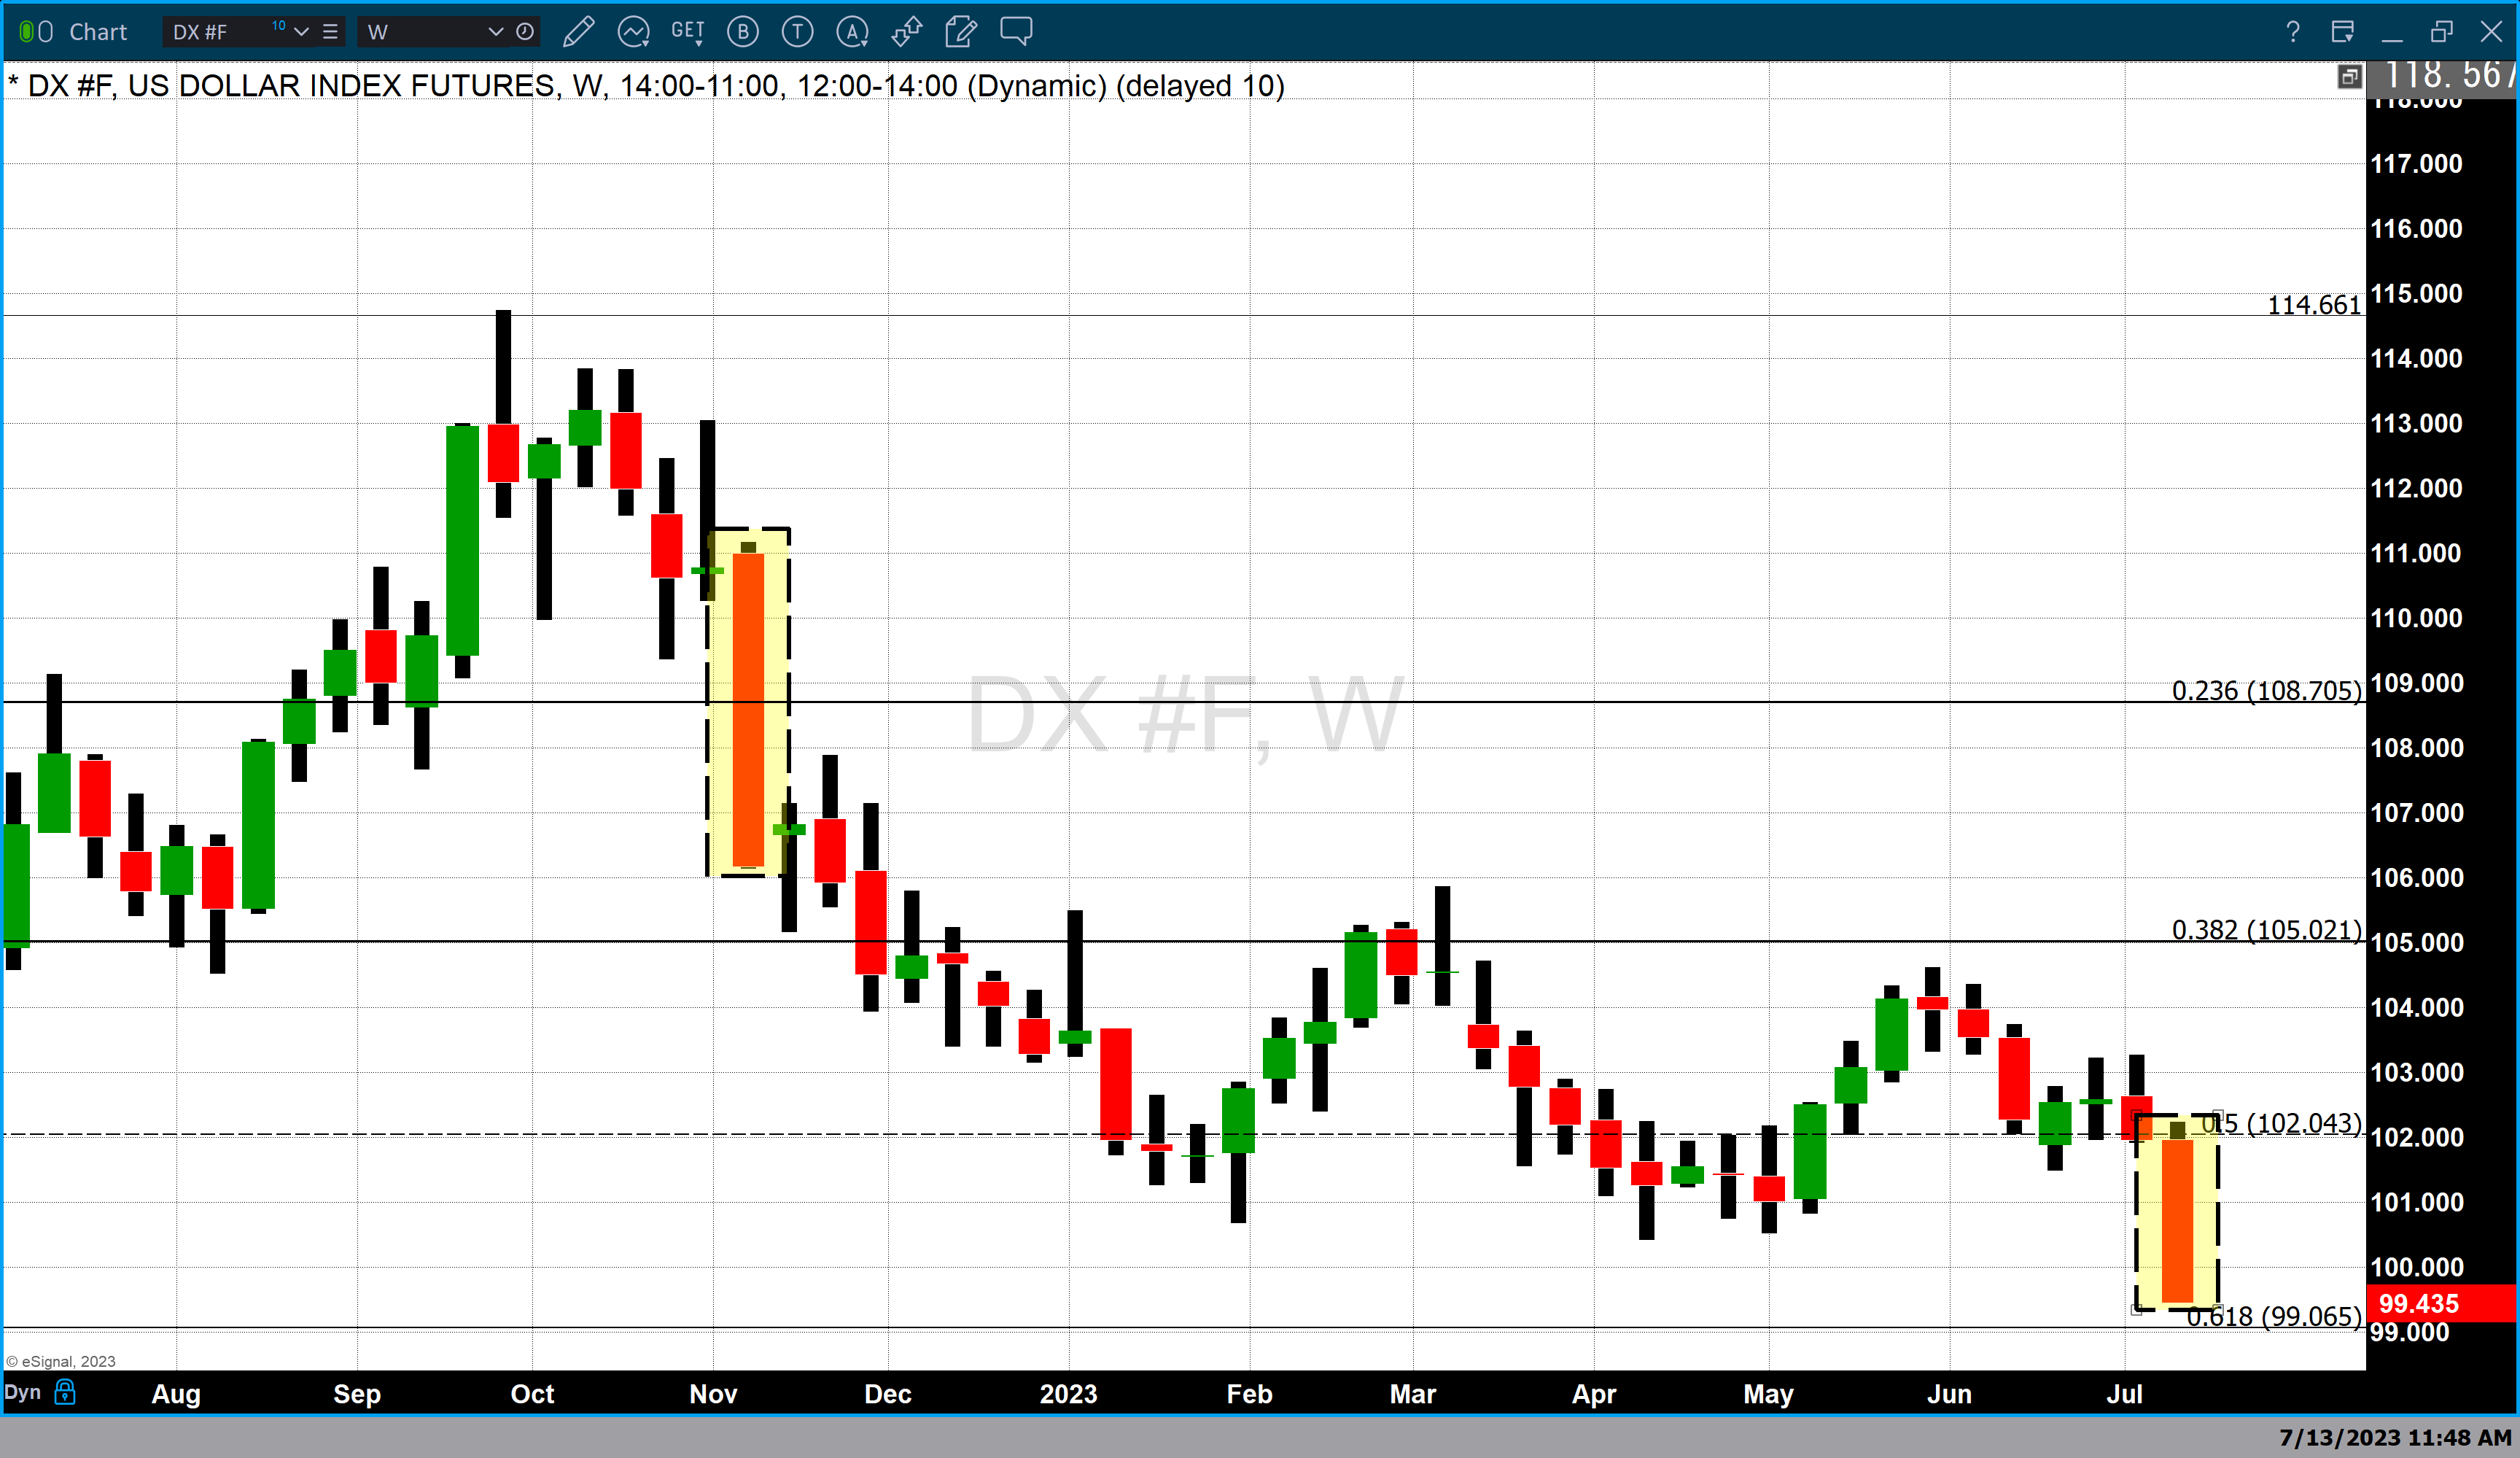
The dollar index is a measure of the value of the U.S. dollar relative to a basket of foreign currencies. The basket includes the Euro, Japanese yen, British pound, Canadian dollar, Swedish Corona, and Swiss franc. The euro is the largest weighted component making up approximately 58% of the basket. Therefore, recent weakness in the dollar has been a combination of a reaction to yields in U.S. debt instruments as well as the strengths of other currencies in the yields their central banks offer. As illustrated with the weekly chart above since September 2022 the U.S. dollar index has lost over 14% when compared to the basket of currencies it’s paired against.
Wishing you as always good trading,

Gary S. Wagner - Executive Producer