Gold investors wait for the CPI report on Tuesday

Video section is only available for
PREMIUM MEMBERS
Gold traders and investors are acutely aware of the dynamic impact that tomorrow’s CPI report will have on multiple financial sectors, including gold prices. Gold futures basis, the most active April contract traded to a higher low, and a lower high than Friday. Although gold is trading fractionally higher than Friday’s close, today’s trading range and the open and closing prices have formed a Japanese candlestick called a “doji” which means “the same thing” in Japanese.
A doji (dо̄ji) is the name given to a trading session (on a daily chart) in which the opening and closing levels are virtually equal. This is represented by a candlestick on a chart that looks like a plus sign, although it can contain longer or shorter wicks to either side or both. Based on this shape, market technicians make assumptions about price behavior. A doji generally signals either a trend reversal indication for analysts, but it can also signal indecision (consolidation) about future prices.
The key takeaway from this kind of Japanese candlestick is that neither the bullish nor bearish faction was able to gain control, which would create a green candlestick (when the close is above the opening price), or a red candle (when the session's closing price falls below its opening price). The larger the candlestick, the more the controlling faction was able to move pricing in their desired direction, that’s why little to no body size indicate neither side was successful.
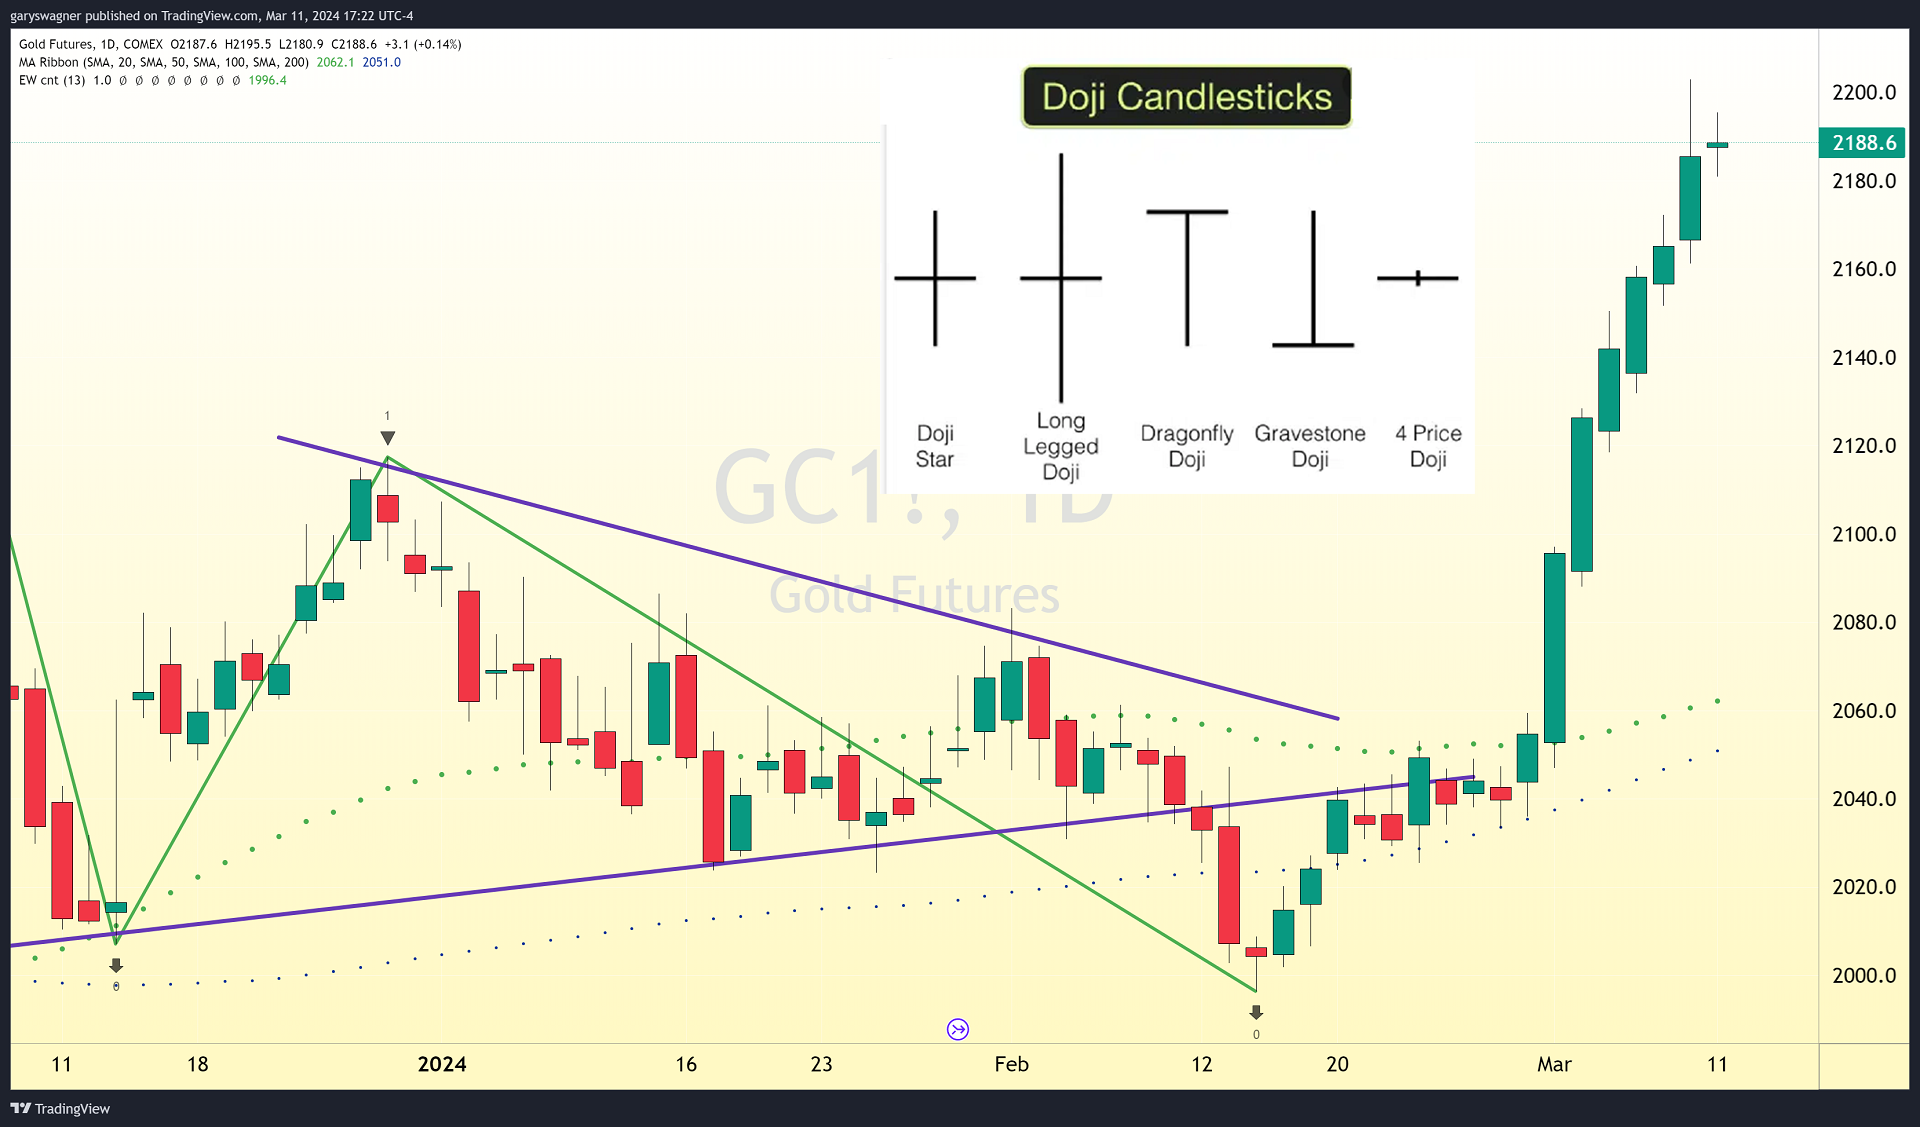
The chart above is a daily chart of gold futures. Today April gold opened at $2187.60, and as of 5:23 PM ET is currently fixed at $2188.60 which means that the price differential between the opening price and the current fixed price is only one dollar. To the Japanese trader, the open, and closing relationship is a much more important factor than the Western trader assumes. To the Western trader, the most important relationship is between the closing price of the prior session and the current closing price, which is why gold is noted as trading up $3.10, because it is comparing the current close to Friday’s close.
This is the first time that gold has not traded to a higher high in the prior seven trading sessions. It indicates that neither the bullish nor bearish faction controlled the outcome of today’s trading session, and suggests that gold prices may either pivot or consolidate. The direction will largely be dependent on the outcome of tomorrow’s CPI report.
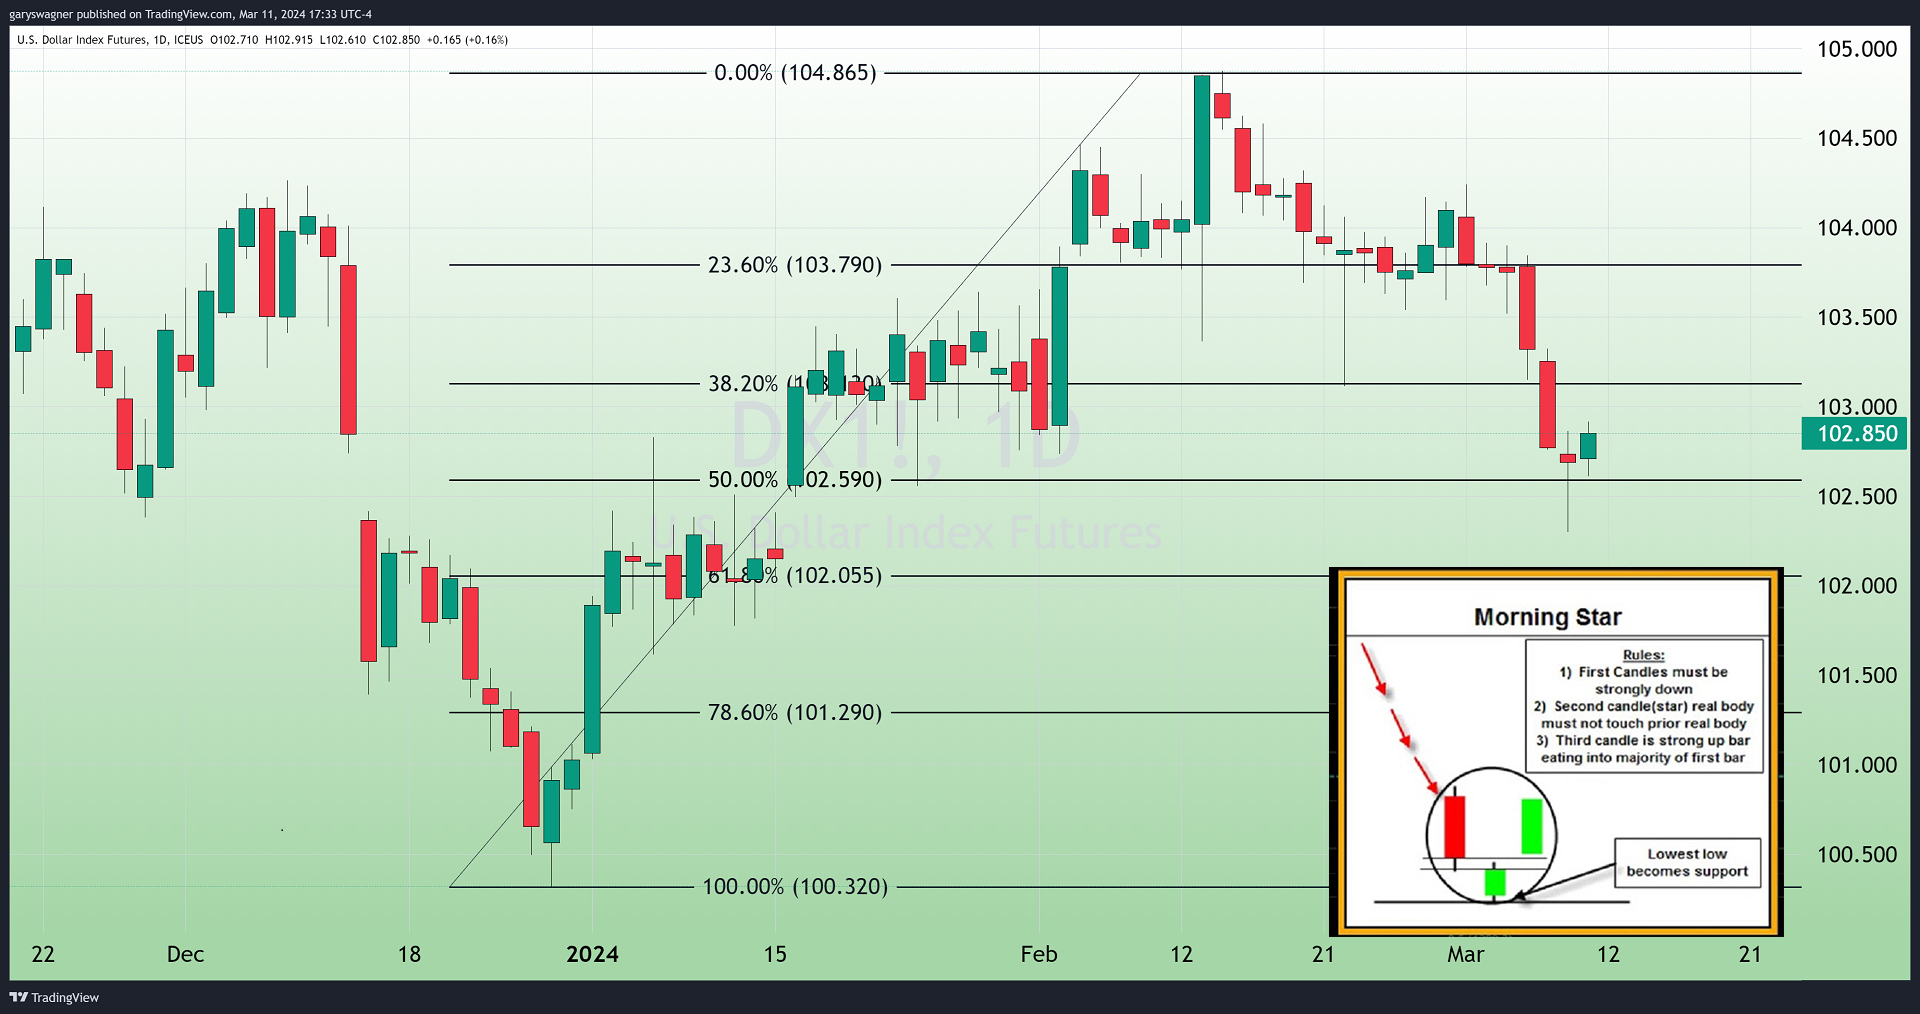
The dollar traded fractionally higher today, up +0.16% taking the dollar index to 102.85. The chart above is a daily Japanese candlestick chart of the dollar index, it shows that Friday’s trading range created a “doji” candlestick which had its wick fall below the 50% retracement which occurs at 102.59. However, the real body (the rectangle drawn between the open and closing price) was small when compared to the upper and lower wicks. Also, the last three days created a candlestick pattern called a “Three River Morning Star”.
The fact that the dollar formed a “doji” on Friday and that today’s session in gold created a “doji” candlestick could potentially signal a pivot in both gold and the dollar. If so, this would predict that the dollar index could move higher, and gold prices could move lower.
Wishing you as always good trading,

Gary S. Wagner - Executive Producer