Gold Market Dynamics: Unveiling Trends through Advanced Charting Techniques

Video section is only available for
PREMIUM MEMBERS
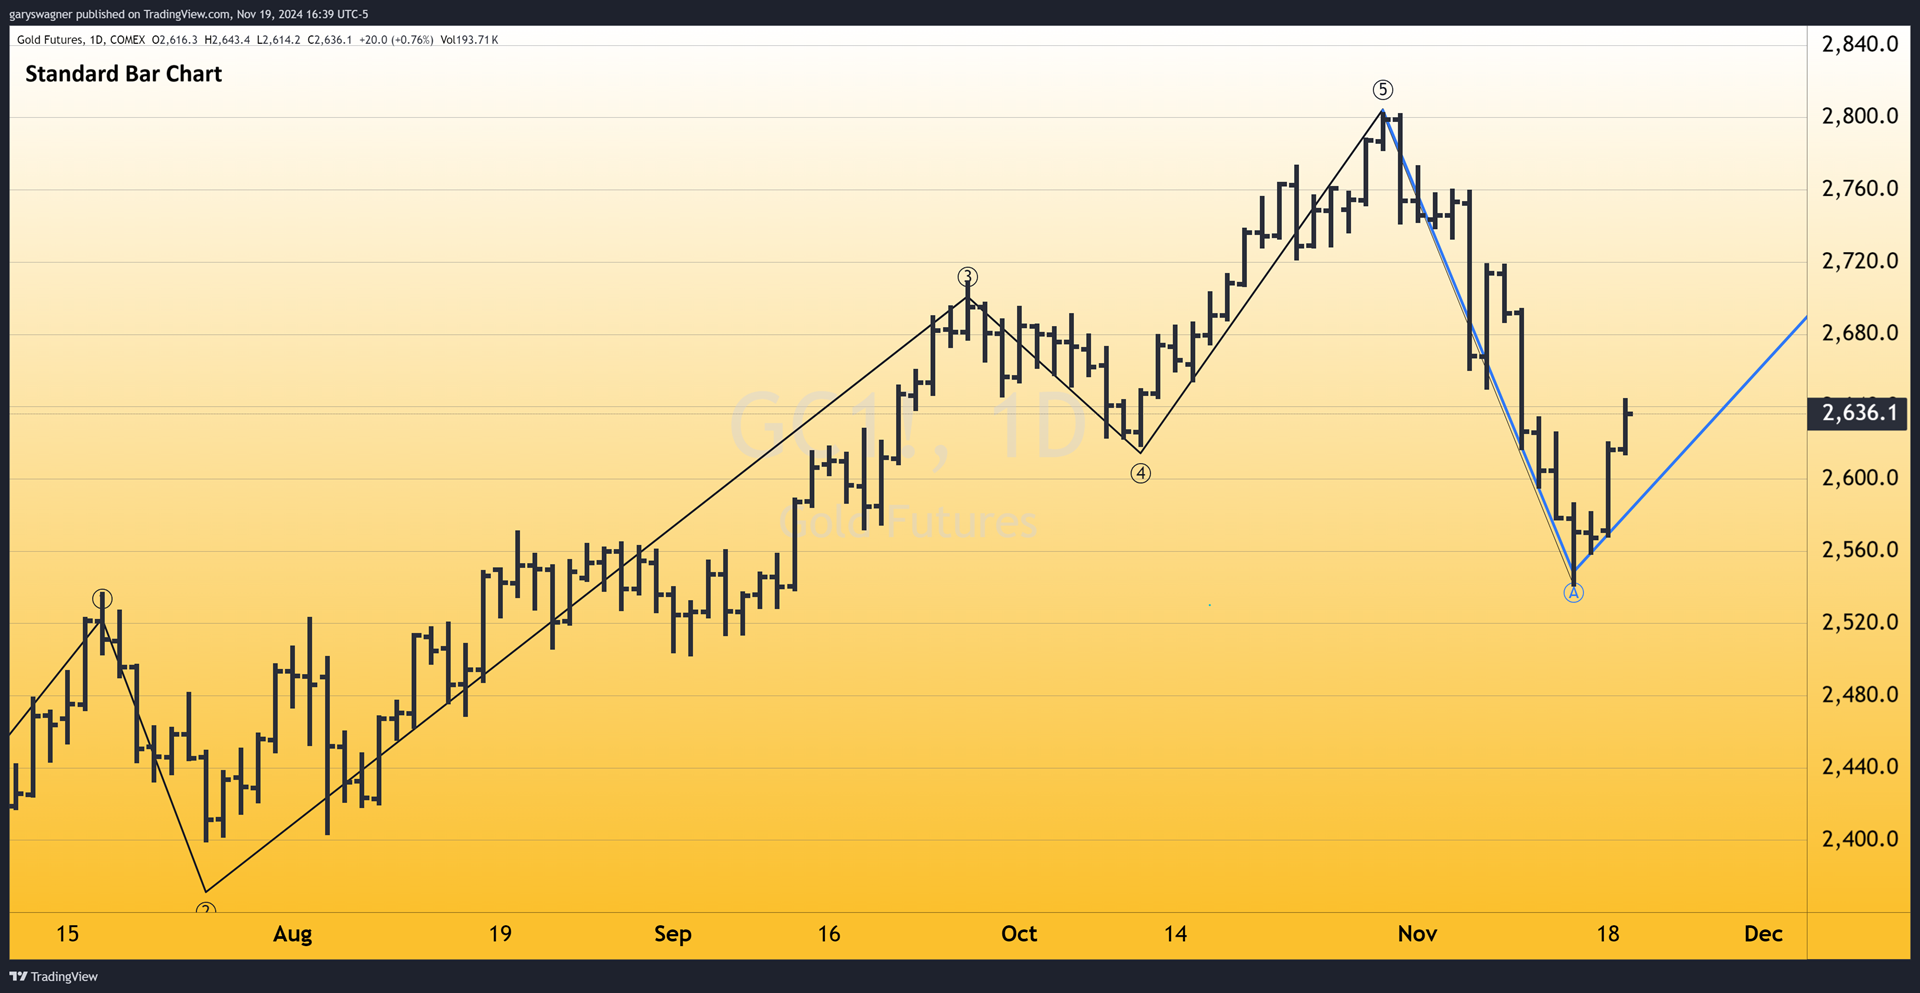
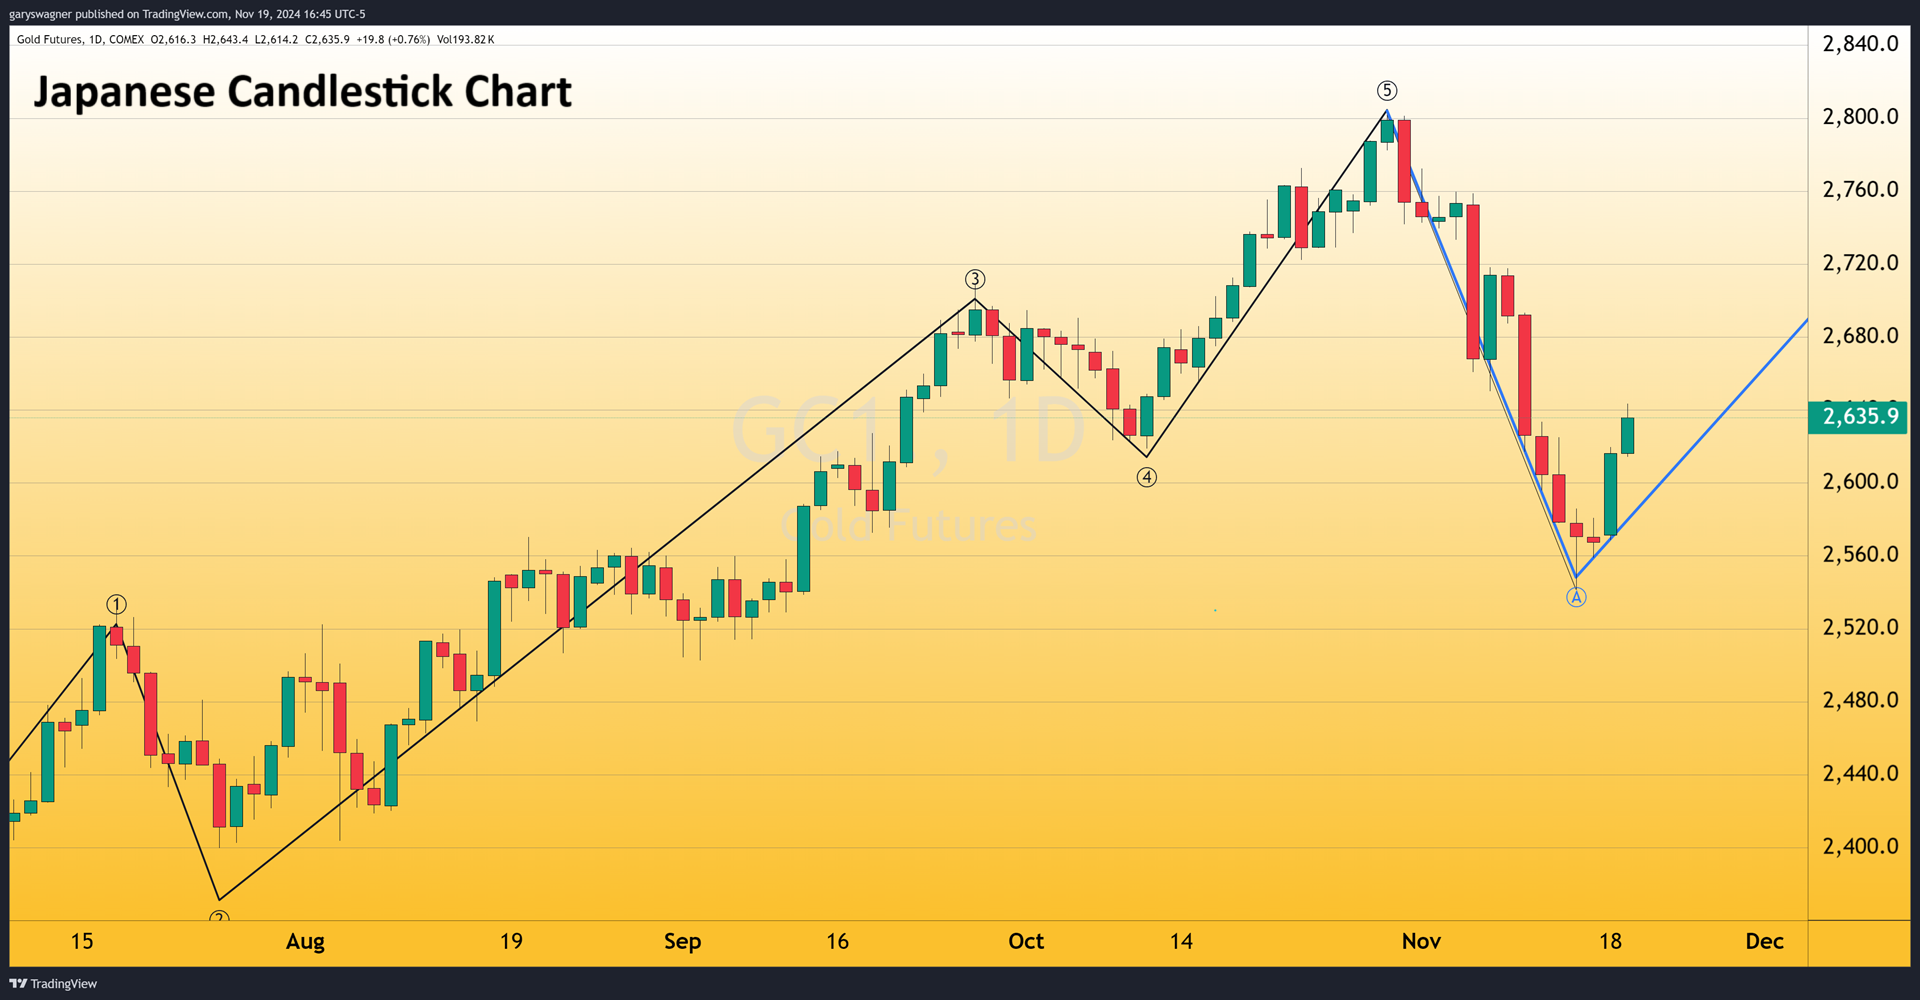
The gold market has recently demonstrated remarkable resilience and potential. After experiencing an intraday low of $2,541.50 on Thursday, the market staged a notable recovery. Friday saw a modest decline of just $3.20, followed by a surge in gold futures that propelled prices upward. Yesterday's trading session opened at $2,571 and closed at $2,616, representing a substantial daily gain of nearly $49. The bullish momentum continued today, with traders pushing prices higher by an additional $18.30.
As of 4:15 PM ET, December gold futures are trading at $2,634.60, marking an impressive advance of approximately 0.71%. This recent price action suggests a potential shift in market sentiment, prompting traders and analysts to closely examine the underlying trends.
Technical analysis relies on various charting methods to interpret market movements, with each approach offering unique insights into price dynamics. Three primary charting techniques stand out in their ability to visualize market trends: bar charts, candlestick charts, and the sophisticated Heikin Ashi chart.

The standard bar chart represents the most basic approach to price visualization. Using a vertical line, it captures the high and low of a trading session, with horizontal lines on the left and right indicating the opening and closing prices. This method provides a straightforward representation of price movement, allowing traders to quickly assess the day's trading range.

Building upon the bar chart foundation, Japanese candlestick charts introduce a more nuanced visual representation. The key innovation lies in the rectangular body that encapsulates the opening and closing prices. Color coding adds an additional layer of information: green rectangles signify closing prices above the opening price, while red rectangles indicate the opposite.
The upper and lower wicks extend from the rectangle to the session's high and low points, respectively. This color-coded approach provides traders with an immediate visual cue about the day's price action, making it easier to identify potential trend changes and market sentiment.

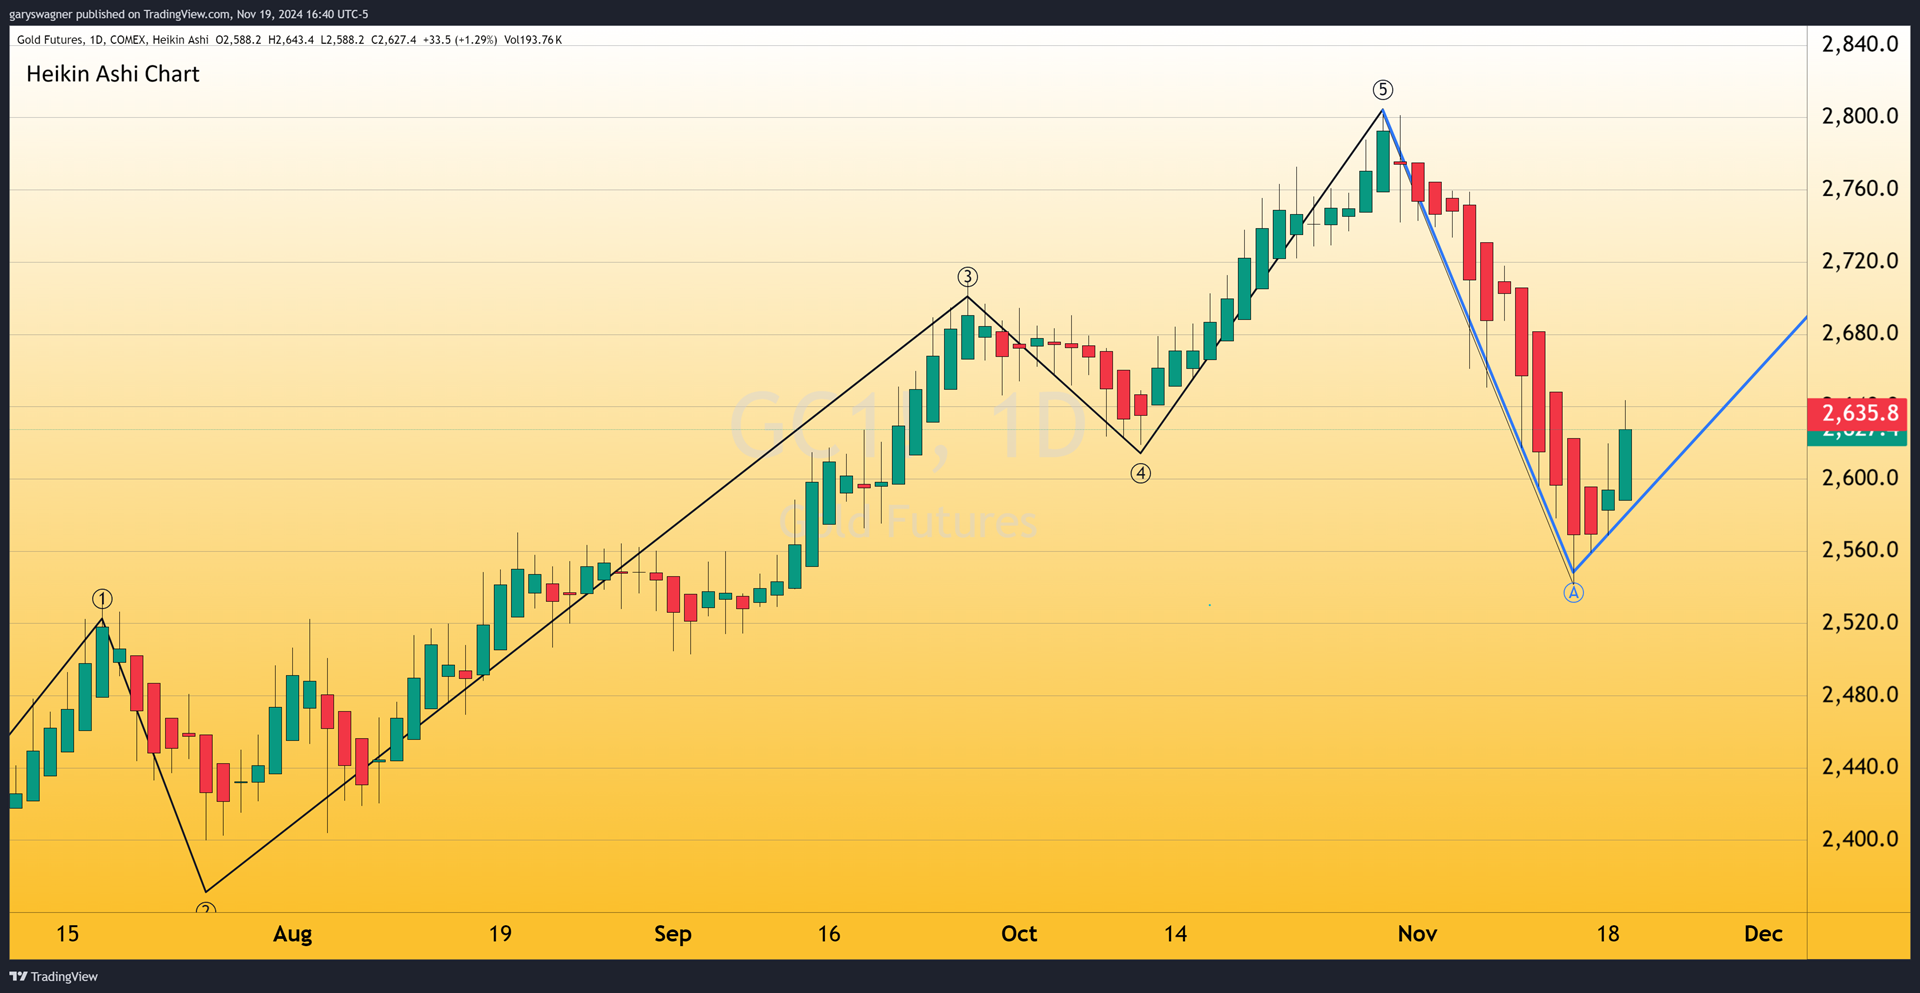
The Heikin Ashi chart represents a sophisticated evolution in technical analysis. Derived from Japanese terminology—"Heikin" meaning average and "Ashi" referring to pace—this charting technique offers a unique approach to understanding market dynamics.
The fundamental difference lies in how the opening price is calculated. Unlike traditional methods, the Heikin Ashi chart derives its opening price from the midpoint of the previous candle. This innovative approach creates a smoother, more averaged representation of price movement.
The true power of the Heikin Ashi chart becomes apparent when analyzing potential market reversals. Traders can identify key trend changes through subtle yet significant visual cues:
The contraction of candle body sizes serves as a critical indicator of potential trend shifts. The transformation from red to green candles signals a bullish reversal, while the opposite movement suggests a bearish trend. In the recent gold market, the Heikin Ashi chart clearly illustrates this phenomenon, with the red candle size diminishing and ultimately pivoting to a green candle.
While each charting method offers valuable insights, the Heikin Ashi approach stands out in its ability to: Smooth out price fluctuations, provide clearer trend identification, highlight potential reversal, points, reduce market noise, offer a more intuitive understanding of trend strength.
The recent gold market movement underscores the importance of sophisticated charting techniques. The Heikin Ashi chart, in particular, demonstrates its value in identifying nuanced market trends and potential reversals. As financial markets continue to evolve, traders who leverage advanced analytical tools like the Heikin Ashi chart position themselves to make more informed and strategic trading decisions.
Wishing you, as always good trading,

Gary S. Wagner - Executive Producer