Gold's Bullish Resurgence: A Technical Analysis of Recent Price Movements

Video section is only available for
PREMIUM MEMBERS
Gold has recently demonstrated remarkable resilience and bullish momentum, captivating investors and market analysts alike. The precious metal's journey to new heights began on July 26, 2023, when December gold futures opened at $2,411.70 and closed with a modest 0.96% gain at $2,433.60. This seemingly unremarkable start set the stage for one of the most spectacular rallies in gold's history.
Despite initial volatility, including a brief dip to $2,403.80 on August 5, gold embarked on an extraordinary nine-week ascent. The culmination of this remarkable run occurred on September 26, when December gold futures reached an unprecedented intraday high of $2,708.70. This meteoric rise represented a staggering increase of $279, or 12.87%, in just nine weeks.
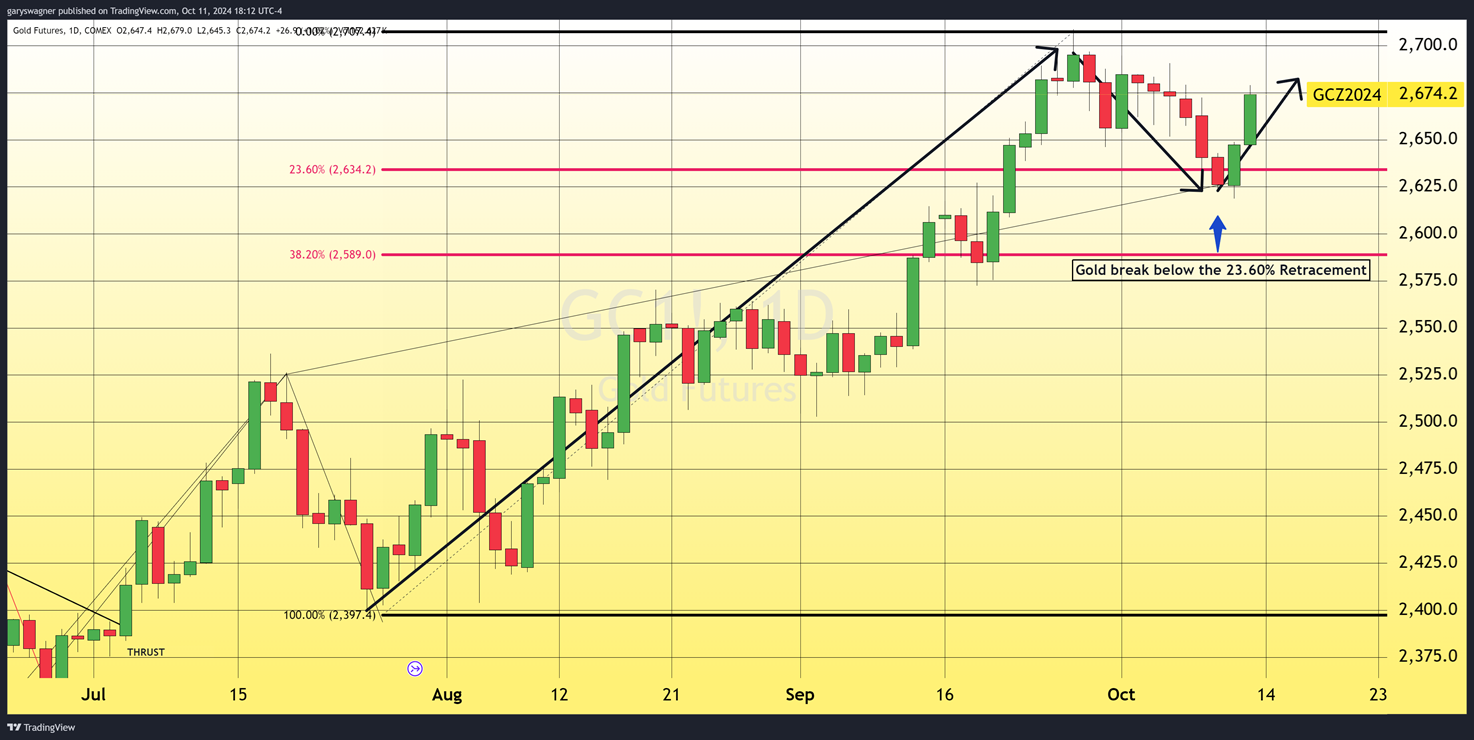
As the dust settled on this historic rally, we turned our attention to potential retracement levels. Technical analysts employ various methods to forecast price corrections, our preference leans towards two prominent techniques. The first involves identifying former price tops, which often serve as strong support levels. The second utilizes Fibonacci retracements, a powerful tool derived from the ancient concept of the Golden Ratio.
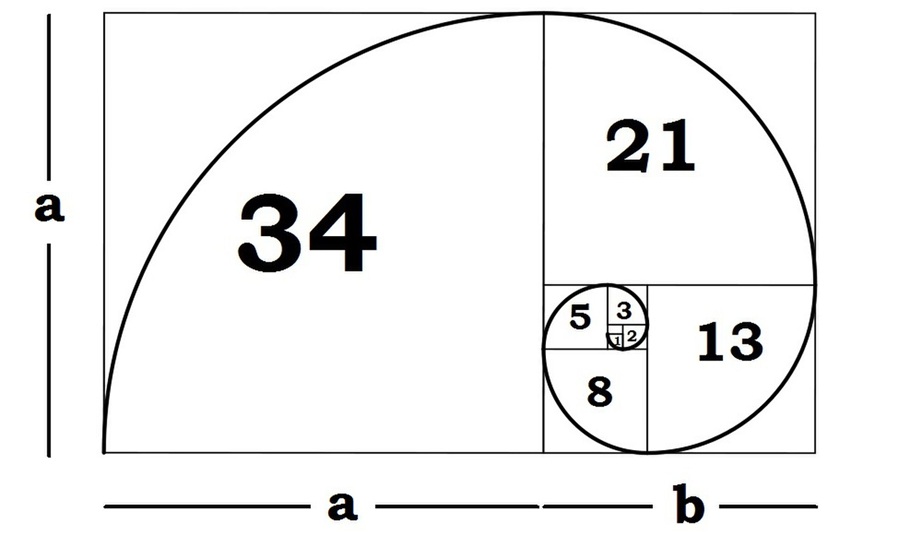
Fibonacci retracements are based on the Fibonacci sequence, (0, 1, 1, 2, 3, 5, 8, 13, 21, ...) where each number is the sum of the two preceding ones. This sequence yields ratios that, when applied to price charts, can indicate potential support or resistance levels. The key Fibonacci ratio of 0.618 (and its inverse, 1.618) forms the foundation of this analysis, with other important levels including 23.6, 38.2, and 78.6.
In gold's recent price action, the 23.6% Fibonacci retracement level at $2,634.20 proved significant. On October 9, December gold futures briefly traded below this level, the following day saw gold open near the retracement level and close decisively higher at $2,647.30, gaining over $21. This bullish momentum continued on October 11, with gold surging an additional $26.90 to settle at $2,674.20.

The rapid recovery and subsequent price gains above the 23.6% Fibonacci level indicate that gold's brief correction may have run its course.
As global economic conditions remain uncertain and geopolitical tensions persist, gold's appeal as a safe-haven asset is likely to endure. Investors and traders will be closely monitoring key technical levels and fundamental factors that could influence gold's trajectory in the coming weeks and months. With its recent display of strength and resilience, gold appears well-positioned to continue its bullish momentum, potentially challenging and surpassing its recent all-time highs.
Editor's Note:
On Monday, October 14, I will undergo a long-overdue knee replacement surgery. The procedure is scheduled as an outpatient operation, with the expectation of same-day discharge. Depending on the recovery process, I anticipate resuming daily reports by midweek.
I appreciate your understanding during this brief hiatus and apologize for any inconvenience this may cause our valued subscribers. Rest assured, I am eager to return and continue providing you with cutting-edge market analysis for years to come.
Wishing you as always good trading,

Gary S. Wagner - Executive Producer