Gold’s candlestick is a “dragonfly doji” which could indicate a key reversal

Video section is only available for
PREMIUM MEMBERS
In Wednesday's New York and Globex trading sessions, gold prices experienced a modest uptick as the U.S. dollar weakened. As of 5:50 PM EDT, December gold futures were trading at $2,526.50 per ounce, marking a slight increase of $1.70 or 0.07%. This movement comes on the heels of last Thursday's record-setting close at $2,560.30 per ounce.
The day's trading dynamics revealed an intriguing interplay between gold prices and the dollar's performance. Despite the U.S. dollar index tumbling by 0.47% to 101.287, gold's gains were relatively muted. This suggests that traders were primarily inclined to bid gold prices lower, counteracting some of the support typically provided by a weaker dollar.
Wednesday's trading range for December gold futures presented several noteworthy characteristics. The contract reached an intraday low of $2,502.70, marginally below Tuesday's low of $2,504.40. Similarly, the day's high of $2,531.50 fell short of the previous session's peak of $2,539.50. These lower highs and lower lows indicate a continuation of the short-term downtrend.
However, the most fascinating aspect of the day's trading emerged in the form of a specific Japanese candlestick pattern known as a "Doji." This particular formation occurred because gold opened and closed at nearly identical price points, with only a $1.90 difference between the open and closing prices. In Japanese candlestick analysis, a Doji represents a state of equilibrium between bullish and bearish market forces, suggesting indecision among traders.
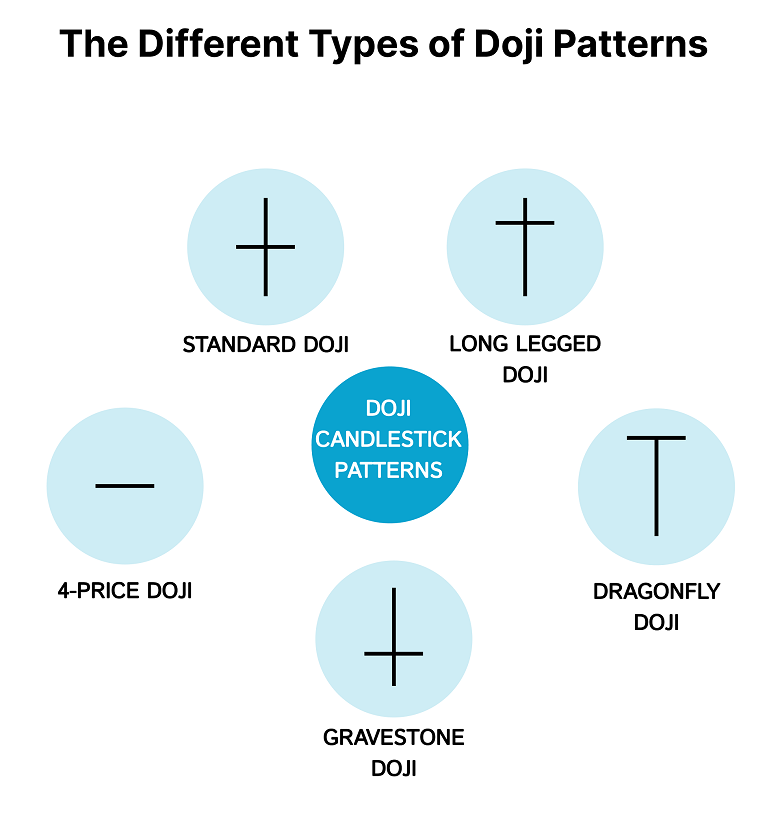
Further analysis reveals that Wednesday's Doji can be classified more specifically as a "Dragonfly Doji." This rare formation is characterized by the opening and closing prices occurring near the day's high, coupled with a significant range between the high and low prices. The long lower shadow of the dragonfly Doji indicates aggressive selling during the session, but the recovery to close near the daily high suggests equally aggressive dip-buying.
In the context of technical analysis, the appearance of a dragonfly doji after a downtrend can be particularly significant. It may signal the emergence of price support and the potential for an upward reversal. However, traders typically await confirmation from the following day's price action before drawing definitive conclusions. A strong green candle with higher highs and lows would provide such confirmation.
Adding another layer of complexity to the analysis, the positioning of Wednesday's dragonfly doji below the real body of Tuesday's candle classifies it as a "star in the morning position." This configuration further enhances its potential as a bullish reversal signal, pending confirmation.
The rarity of dragonfly doji formations makes them a point of keen interest for technical analysts. While they primarily indicate a temporary balance between buying and selling pressures, their occurrence, especially when followed by a strong confirming candlestick, can offer unique insights not readily apparent through conventional Western technical indicators.
Wishing you as always good trading,

Gary S. Wagner - Executive Producer