One candlestick type identified key reversals in both gold futures and the dollar

Video section is only available for
PREMIUM MEMBERS
In yesterday’s article, the primary focus was on the impact that the upcoming CPI report would have on multiple financial sectors including gold and the dollar. We spoke about a single Japanese candlestick, a “doji” which occurred yesterday in the daily Japanese candlestick chart of gold futures, and on Friday in the dollar index. A doji occurs when the open and closing prices are identical or a few ticks apart during a trading session.
The most important component of a doji can be viewed as a reflection of the key difference between how a Japanese market technician uses price information versus a Western market technician. The Japanese market technician believes that the most critical information is the relationship between a session's opening and closing price. Whereas, the Western technician puts primary importance on the session's closing price versus the prior closing price. A doji reveals that neither the bullish nor bearish factions were able to control price between the open and close. Therefore, they often occur at critical price tops or bottoms.
Early forecasts by economists expected that the headline consumer price index, which includes healthcare, housing costs, energy, as well as food to rise by 3.1% in February, the numbers came in above that at 3.2% year-over-year. However, more worrisome was the forecast of the core CPI which strips out volatile items like energy and food which was expected to show an increase of 0.4% month over month well above January’s inflation numbers which showed inflation increased month over month by 0.3%.
Because the forecast for the upcoming CPI reflected that inflation would continue to run hot the identification of a doji candle identified in the dollar index on Friday, and gold yesterday were significant because they can be a signal of an imminent key reversal.
Today the Bureau of Labor Statistics released the most current information on inflationary data from February. “The Consumer Price Index for All Urban Consumers (CPI-U) increased 0.4 percent in February on a seasonally adjusted basis, after rising 0.3 percent in January, the U.S. Bureau of Labor Statistics reported today. Over the last 12 months, the all items index increased by 3.2 percent before seasonal adjustment.
The index for shelter rose in February, as did the index for gasoline. Combined, these two indexes contributed over sixty percent of the monthly increase in the index for all items. The energy index rose 2.3 percent over the month, as all of its component indexes increased. The food index was unchanged in February, as was the food at home index. The food away from home index rose 0.1 percent over the month.”
Because the report revealed inflation was running even hotter than the forecast by economists’ gold dropped significantly because the report raised questions about whether the Federal Reserve would initiate its first rate cut by June. This also caused the dollar to trade higher, as a byproduct of treasury yields increasing.
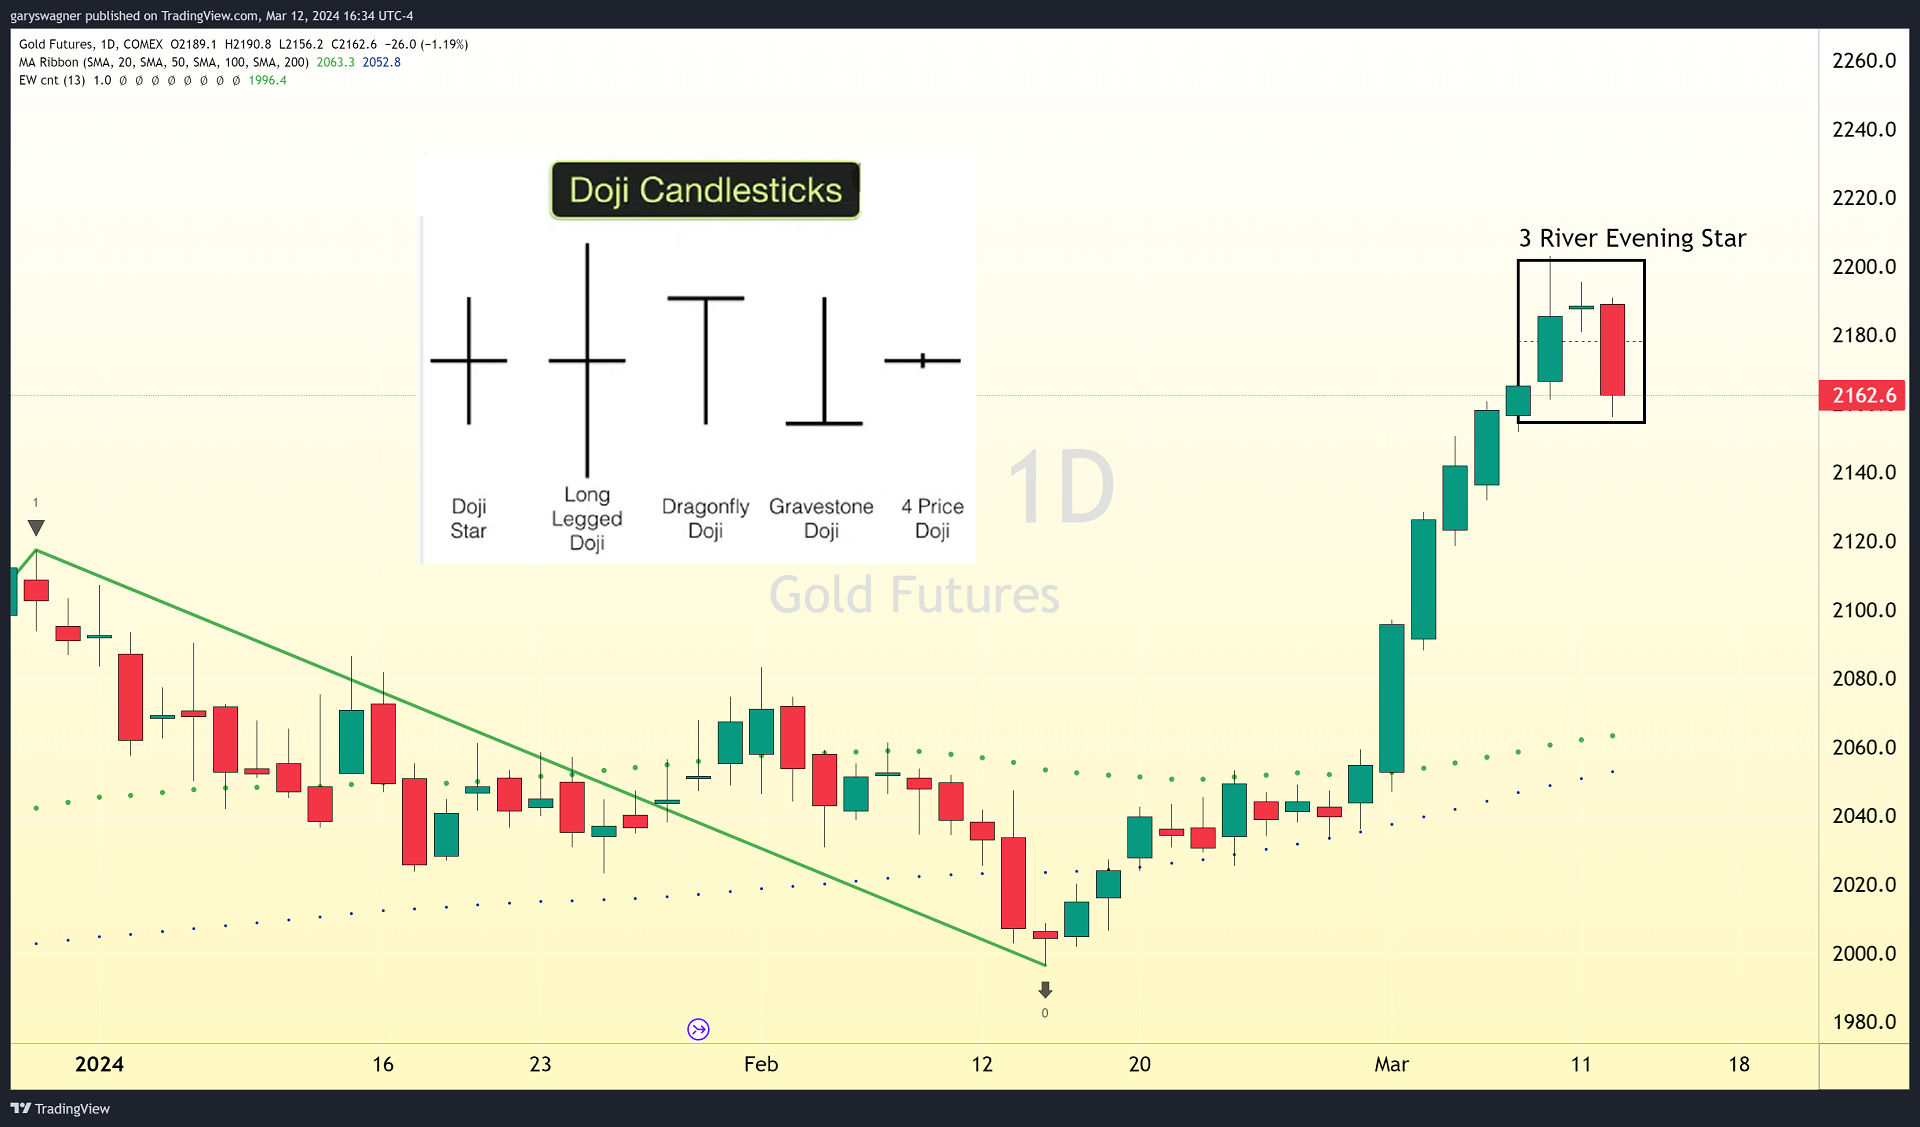
As of 4:30 PM EDT, gold futures basis the most active April contract is trading down $26.10 or -1.19% and fixed at $2162.50. Today’s price decline created a candlestick pattern called a “three river evening star”. It can be seen on the daily Japanese candlestick chart of gold futures above.
It is composed of three candlesticks after a defined uptrend. The first candlestick is typically a long green candle. This is followed by a doji or spinning top in which the real body is above the real body of the prior green candle. The third candle, which is a long red candle, completes the pattern. It is interpreted as a bearish reversal pattern.
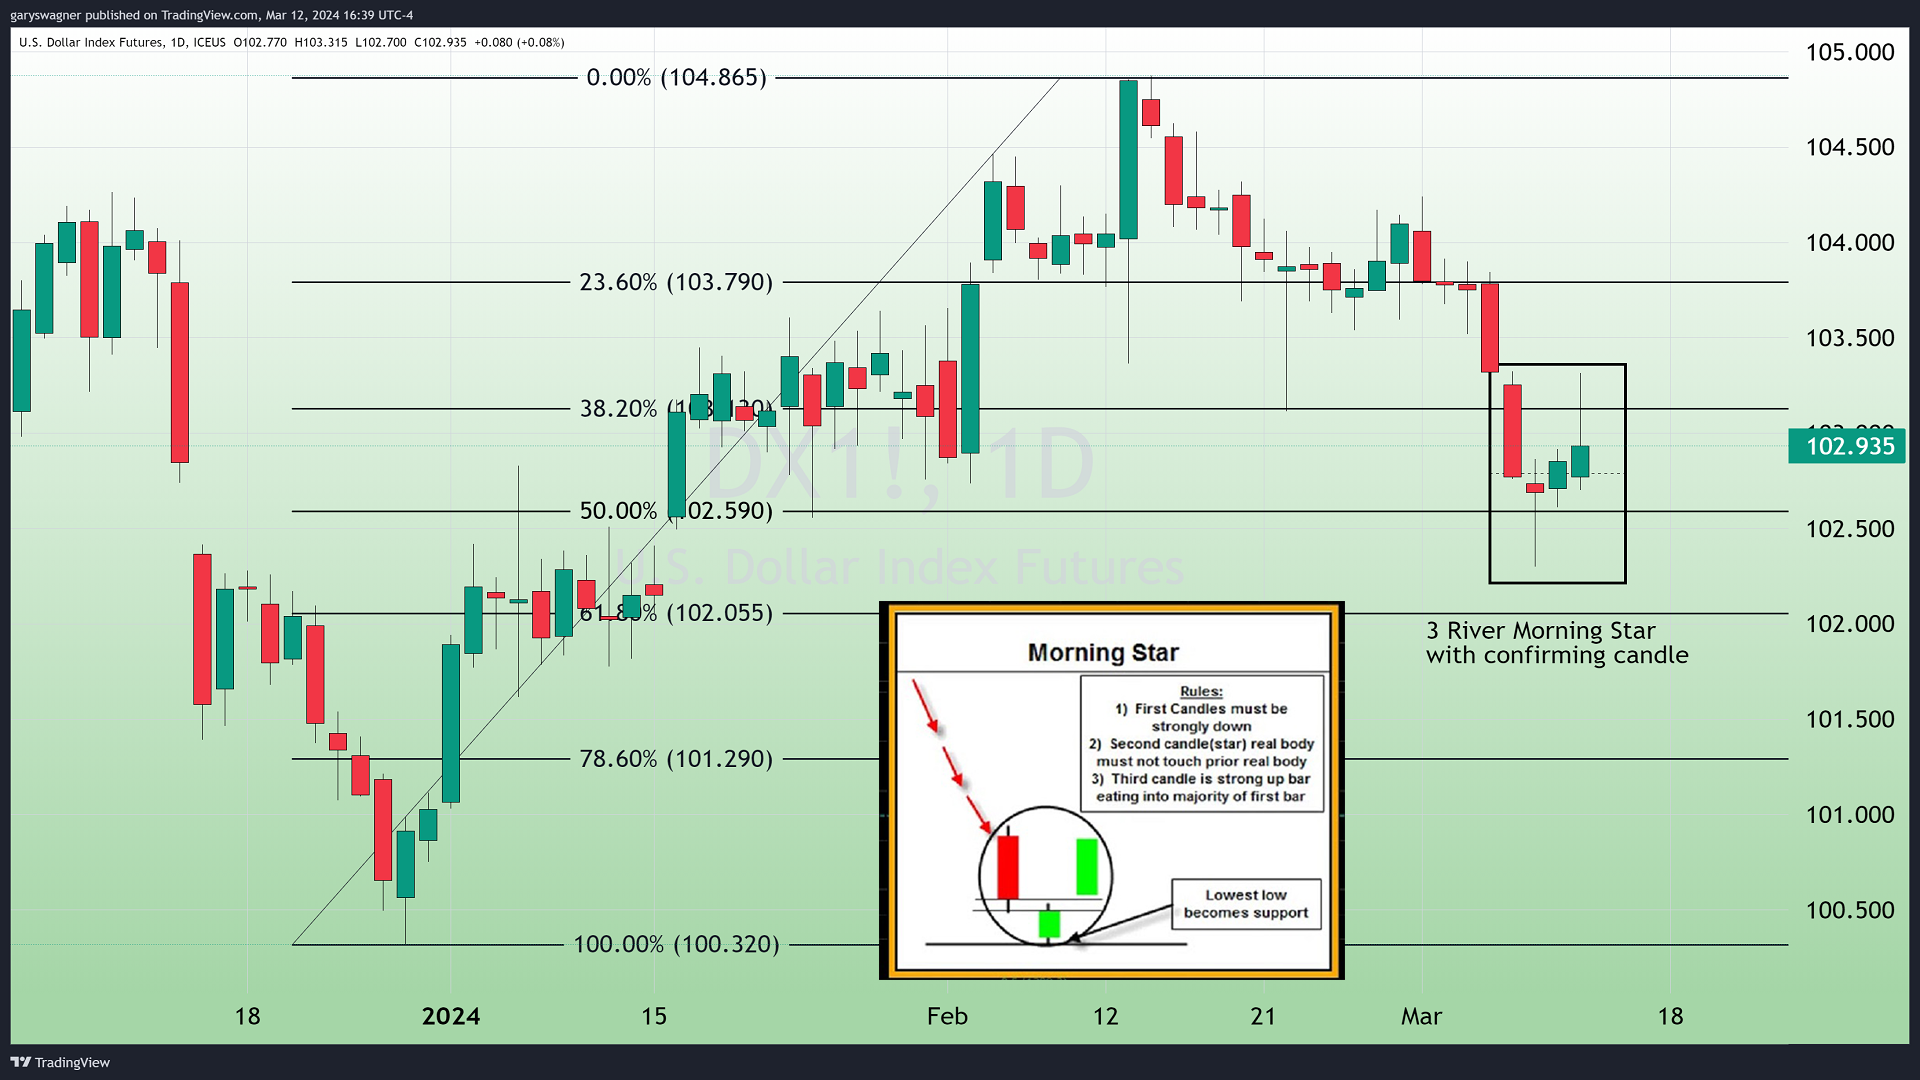
A doji candlestick was identified on a daily chart of the dollar index on Friday. Yesterday we identified a Japanese candlestick pattern called a “three river morning star”.
The morning star is also composed of three candlesticks after a defined downtrend. The first candlestick is typically a long red candle. This is followed by a doji or spinning top in which the real body is below the real body of the prior red candle. The third candle, which is a long green candle completes the pattern. It is interpreted as a bullish reversal pattern.
The identification of a doji does not always indicate a precursor to a key reversal. However, in these two instances, the dojis identified in gold and the dollar provided us a reason to look for a key reversal and thereby proved to be valuable information.
Wishing you as always good trading,

Gary S. Wagner - Executive Producer