Market sentiment for gold shifts focus again to geopolitical tensions and rising inflation

Video section is only available for
PREMIUM MEMBERS
Yesterday’s market sentiment was an underlying explanation of why gold traded lower on the day. Market participants focused upon Chairman Powell’s speech on Monday, where he opened the door for larger rate hikes (1/2% rather than ¼%) at one or more of the six remaining FOMC meetings.
In a speech Powell gave at the National Association for Business Economics, he said, “We will take the necessary steps to ensure a return to price stability. In particular, if we conclude that it is appropriate to move more aggressively by raising the federal funds rate by more than 25 basis points at a meeting or meetings, we will do so.”
Oddly, market participants did not react strongly to Powell’s statements until yesterday. Gold futures basis the April contract lost $13, and the candle that formed out of that day contained a lower high and a lower low than the previous day. Using only market sentiment to base market decisions is almost always unreliable when used alone.
Inflation is still running hot; Russia is brutally destroying Ukraine and yields on U.S. treasuries continue to rise. Intrinsically market sentiment is based on emotions, and its sentiment changed from Monday to Tuesday.
A market technician relies almost entirely on technical studies such as pattern recognition. One of the greatest market technicians of our time is Seiko Shimizu, who wrote the book “The Japanese Chart of Charts.” This first book that was translated into English that the Western trader an ability to understand the techniques of his counterpart, the Asian technical trader. I bring this up because I believe here is one of the best explanations of why technical studies seem to have more reliable insight needed to analyze a market. “A chart is like a cat’s whiskers.”
In his book, Seiko Shimizu describes the process a cat uses to catch a mouse, saying, “I don’t think the cat understands the mouse’s feelings and thought patterns.” He then breaks down the components that comprise the data used for fundamental market analysis. Components “such as political and economic conditions, supply and demand, speculation, and the market mood at the time. It would be impossible, however, to express these factors in the form of percentages in order of importance as far as influencing rising and falling market.”
The reason that I have spent the majority of this article talking about the difference between fundamental and technical market analysis is that a market technician does not put the same importance with market sentiment or human emotions.
This is one of the reasons that yesterday I addressed this anomaly on the members page for our premium subscribers, “Today market participants shifted their attention from concerns about rising inflation and the war in Ukraine to yesterday’s speech by Chairman Powell indicating a much more aggressive monetary policy to combat rising inflation. However, I believe that market participants will quickly move their focus back to the more immediate concerns of escalating geopolitical tensions resulting from Russia’s invasion of Ukraine and the effect it will have on raising the current level of inflation.”
The fact is market sentiment can shift on a dime and pivot without rhyme or reason sometimes. Mathematics which provides the core tool that the market technician uses simply put cannot lie or be swayed by human market sentiment.
That is exactly what we saw today as a pivot back to the bullish demeanor, believing that gold prices will rise simply based on the high level of inflation by a quantifiable number. My bullish market sentiment has not changed during corrective periods because I believe so strongly that the charts are indicating that we are still within a long-term extremely bullish rally that took gold from the low of $1061 during December 2015 to the highs achieved six years later which resulted in a doubling in the price of gold to the record high that occurred in August 2020 at $2088.
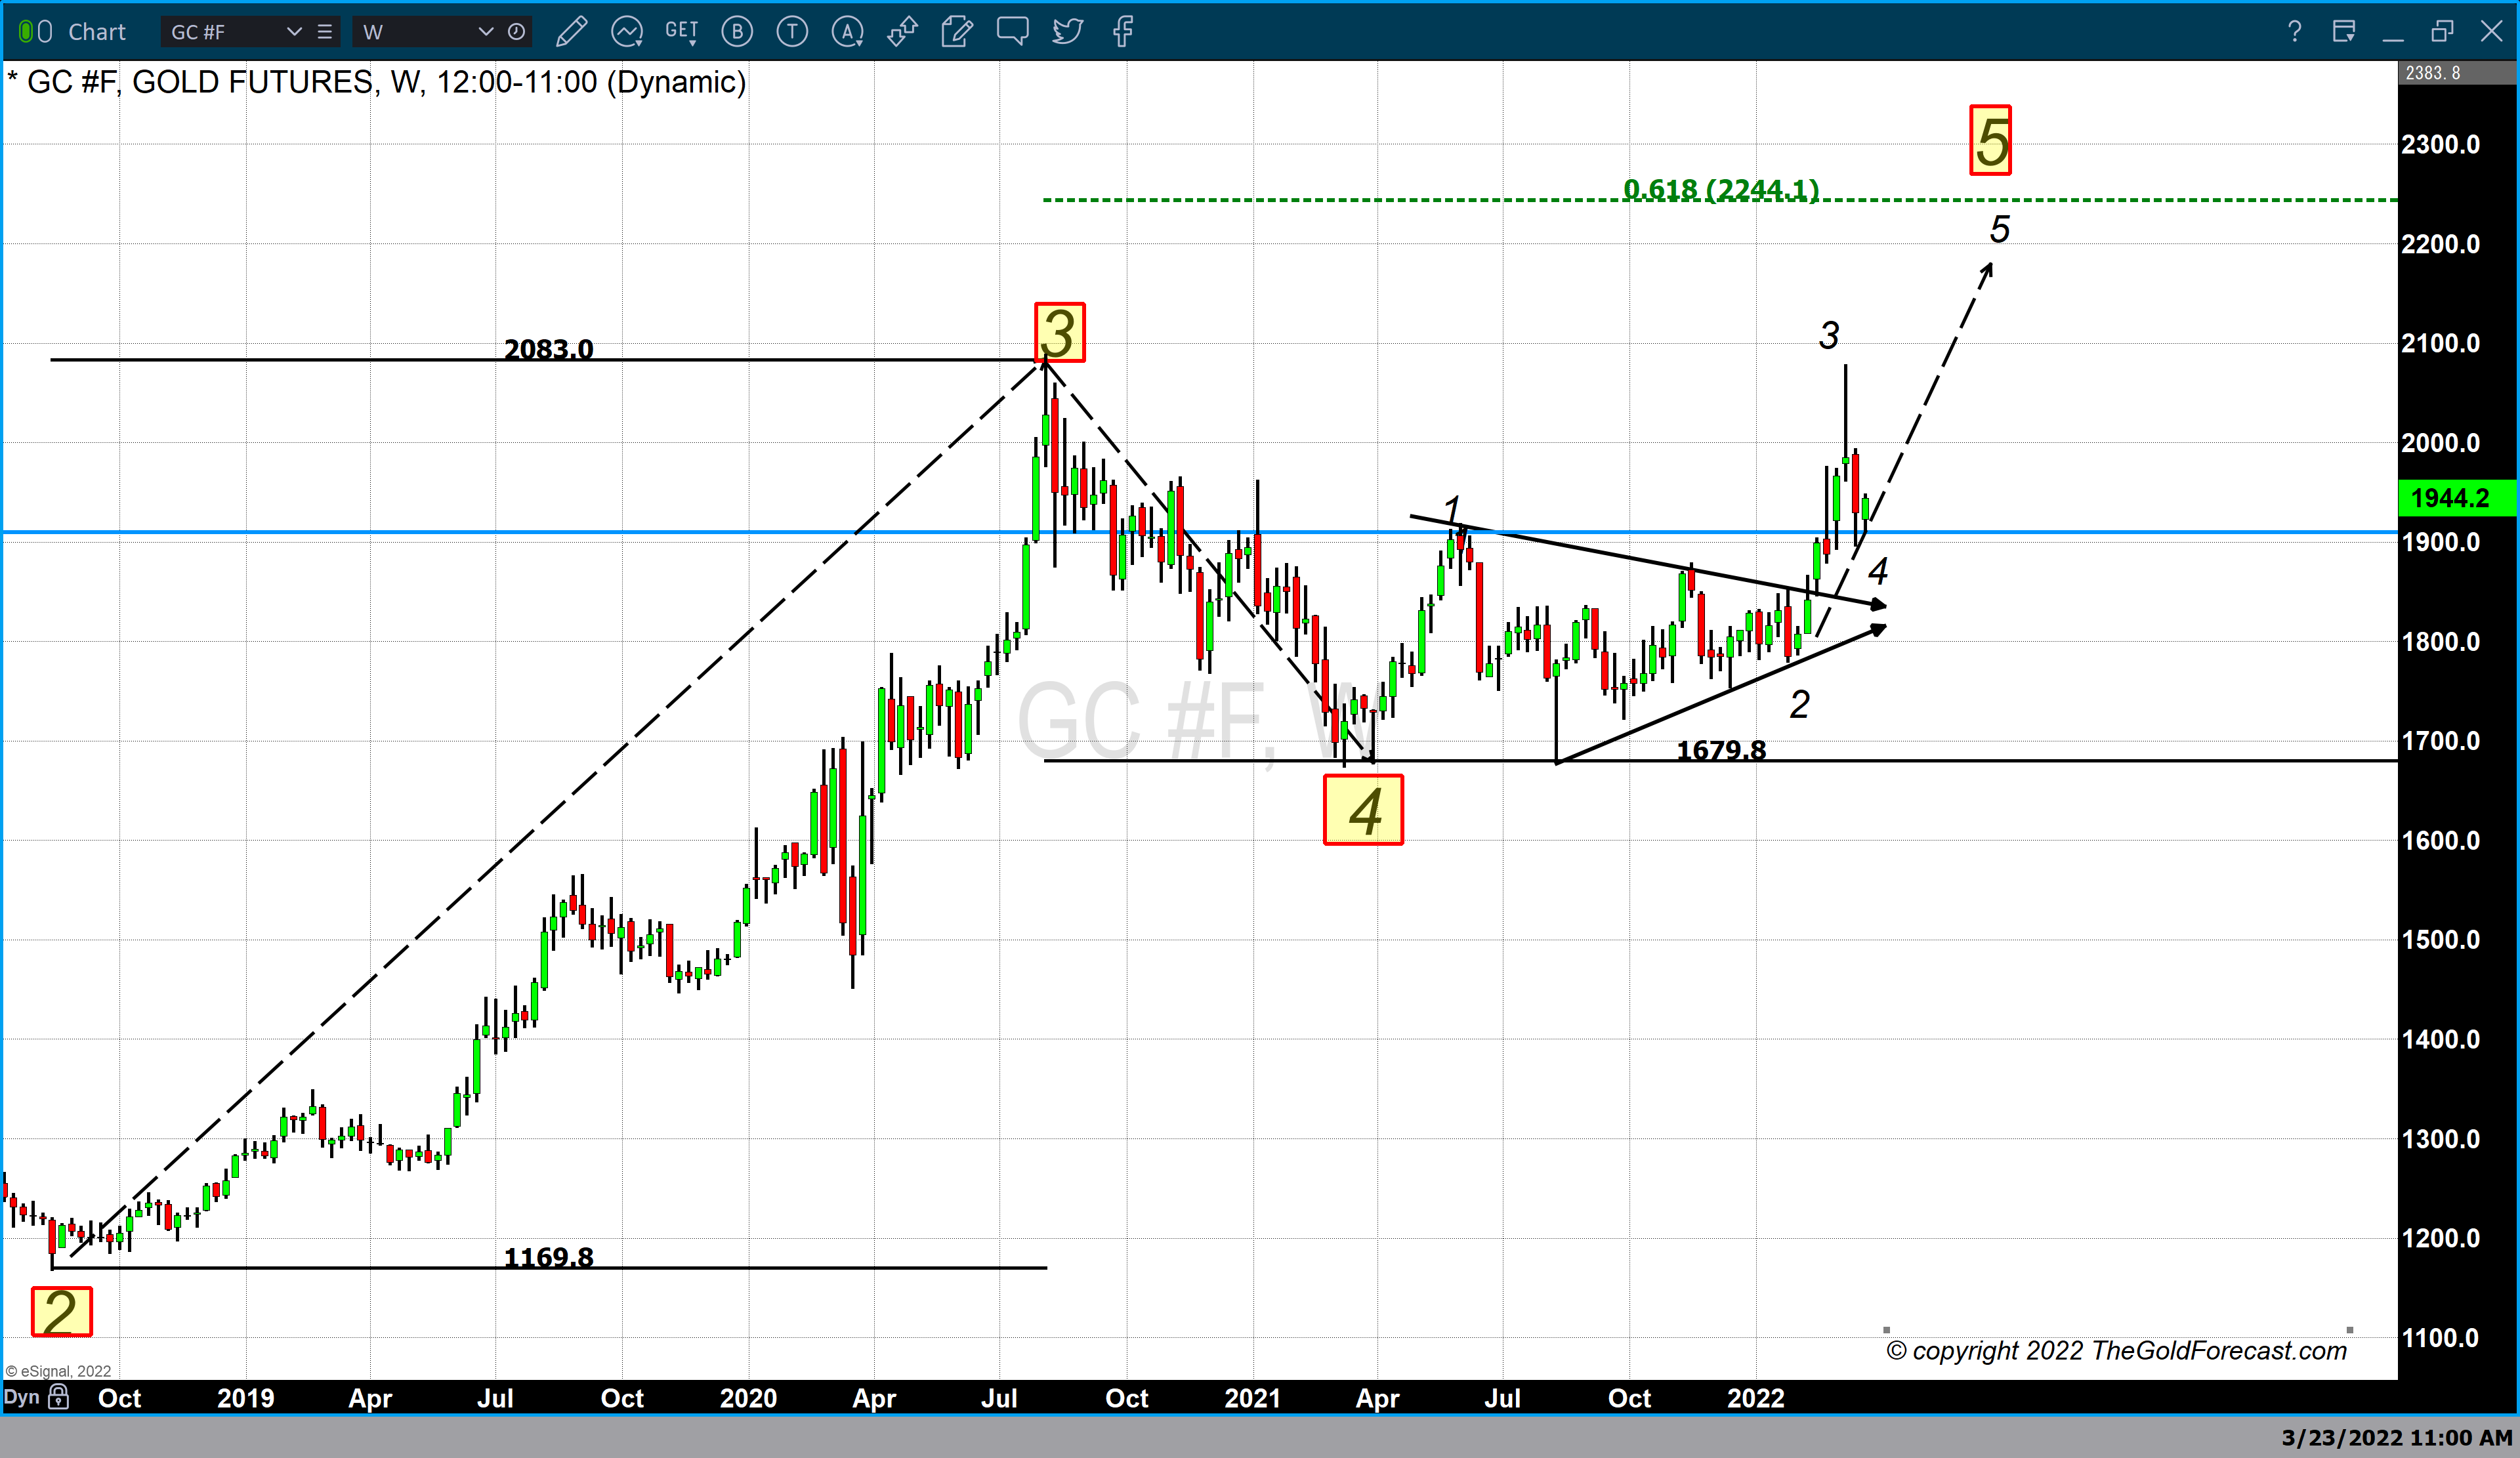
This brings me to my short and interim-term forecast. I remain extremely bullish over the next 4 to 8 months with our technical studies forecasting that gold will trade to a new record high which will conclude this rally taking gold prices to $2100 on the low side and $2300 on the high side. The chart above contains technical studies as well as our short and interim forecast for gold. It utilizes Japanese technical theory incorporating candlestick patterns. These patterns are viewed through market timing created from Elliott wave theory, and price points for entry and exit targets were determined by Fibonacci retracement sets.
Wishing you as always good trading,

Gary S. Wagner - Executive Producer