Gold’s price decline creates significant technical chart damage

Video section is only available for
PREMIUM MEMBERS
As of 4:00 PM, EDT gold basis the most active June 2022 futures contract is currently just under $1900 at $1899.40. That is a net decline of $35 or 1.82%. The dramatic selloff in gold today did create significant chart damage with gold opening and closing below its simple 50-day moving average. Market technicians use the 50-day moving average to ascertain a stock or commodity’s short-term market sentiment. On Friday of last week, gold did trade lower and closed right at the 50-day moving average which is currently fixed at $1936.60. Today gold opened at $1931.90 and traded to a low of $1891.80 before recovering slightly. As of this writing gold is holding on barely to the key psychological level of $1900 per ounce.
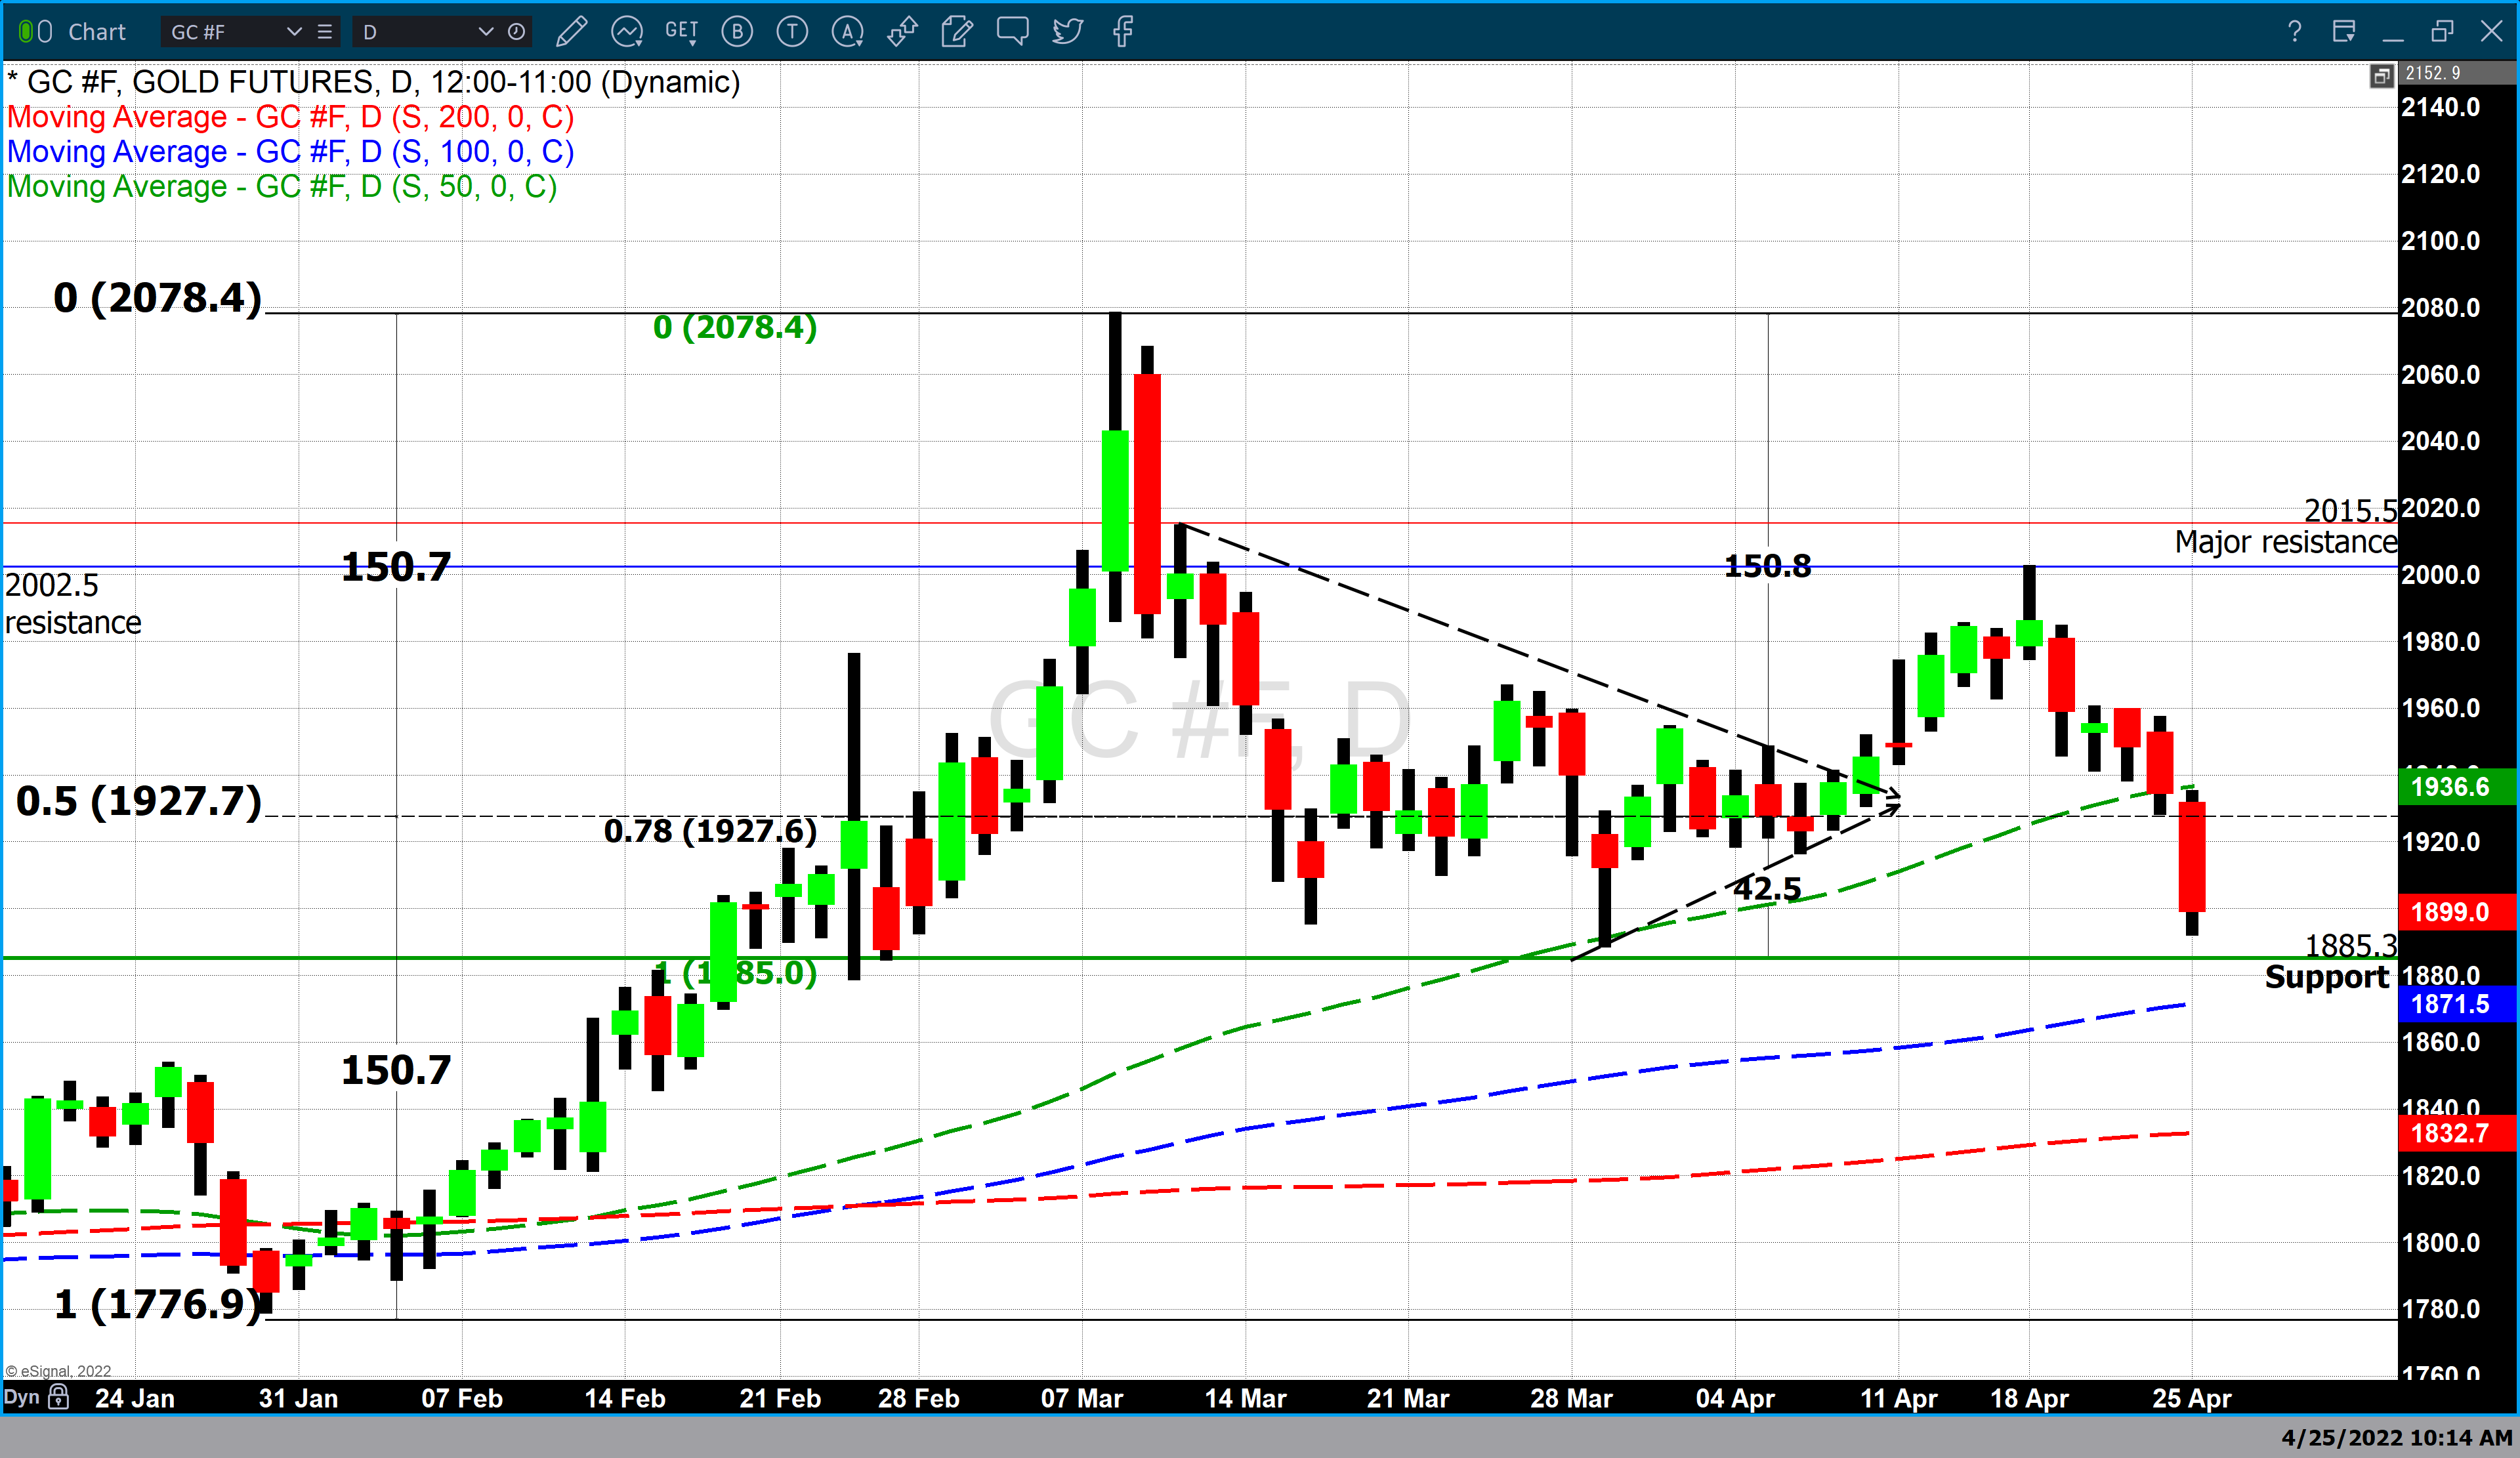
Throughout December and January 2021 gold prices were consolidating and trading in a narrow and defined range both above and below three major moving averages, the 50-, 100-, and 200-day moving averages. All three moving averages were extremely close together in price with a differential between the shortest term 50-day moving average and the longest-term 200-day moving average being just under $10 per ounce. Now the 50 and 100-day MAs are approximately $100 apart.
This all changed in February with two primary factors completely changing market sentiment to extremely bullish for gold. At the beginning of February genuine concerns about spiraling levels of inflation shaped the financial landscape. Market participants began to bid up the price of safe-haven assets such as gold in response to surging inflation. The Labor Department’s CPI (Consumer Price Index) inflation report for December 2021 came in at 7% year-over-year, 7.5% in January, and 7.9% in February. Currently, inflationary pressure continues to rise, with the latest CPI data for March indicating that the current level of inflation is now at 8.5% year-over-year with food, energy, and housing costs as the primary goods and services which continue to experience price increases.
Secondly, on February 24, Russia launched a major invasion of the sovereign country of Ukraine. Before February 24, Russia had amassed roughly 180,000 troops on its borders with Ukraine. On the dawn of the 24th, Russia moved its forces from three fronts into Ukraine. These two factors collectively took gold from the January lows of $1779 to just $10 below the record high of $2088. Gold traded to its highest value this year on March 8, when gold prices reached $2078 per ounce. The invasion of Ukraine has now turned into a major war between those two countries.
In the first week of March, market participants began to bid gold prices lower in anticipation of the first interest rate hike since 2020, when the Federal Reserve reduced its fed funds rate to near zero. Effective March 17, the Federal Reserve voted unanimously to raise interest rates by ¼%. The revised monetary policy of the Federal Reserve has become extremely aggressive, with anticipated rate hikes to occur at each of the subsequent FOMC meetings this year. There is also a strong probability that two of the remaining rate hikes will be ½ a percent each.
Although the war between Russia and Ukraine continues to worsen, market participants in the United States are now more focused on rising yields in U.S. debt instruments such as bonds and Treasuries, reducing the luster of gold as a non-interest-bearing investment. Our technical studies indicate that current support for gold first exists at $1885 per ounce, with strong support at the 100-day moving average, which is currently fixed at $1871.50. Although gold prices are currently under the 50-day moving average indicating that the short-term market sentiment has shifted from bullish to bearish, it is the 200-day moving average that market technicians use to ascertain the long-term market sentiment for a stock or commodity. As long as gold prices remain above their 100 and 200-day moving averages market sentiment on an interim and long-term basis is still considered bullish.
Wishing you as always good trading,

Gary S. Wagner - Executive Producer