Selling pressure and dollar strength take gold dramatically lower

Video section is only available for
PREMIUM MEMBERS
Gold and silver sold off sharply today. A force taking gold lower was dollar strength which then led to selling pressure.
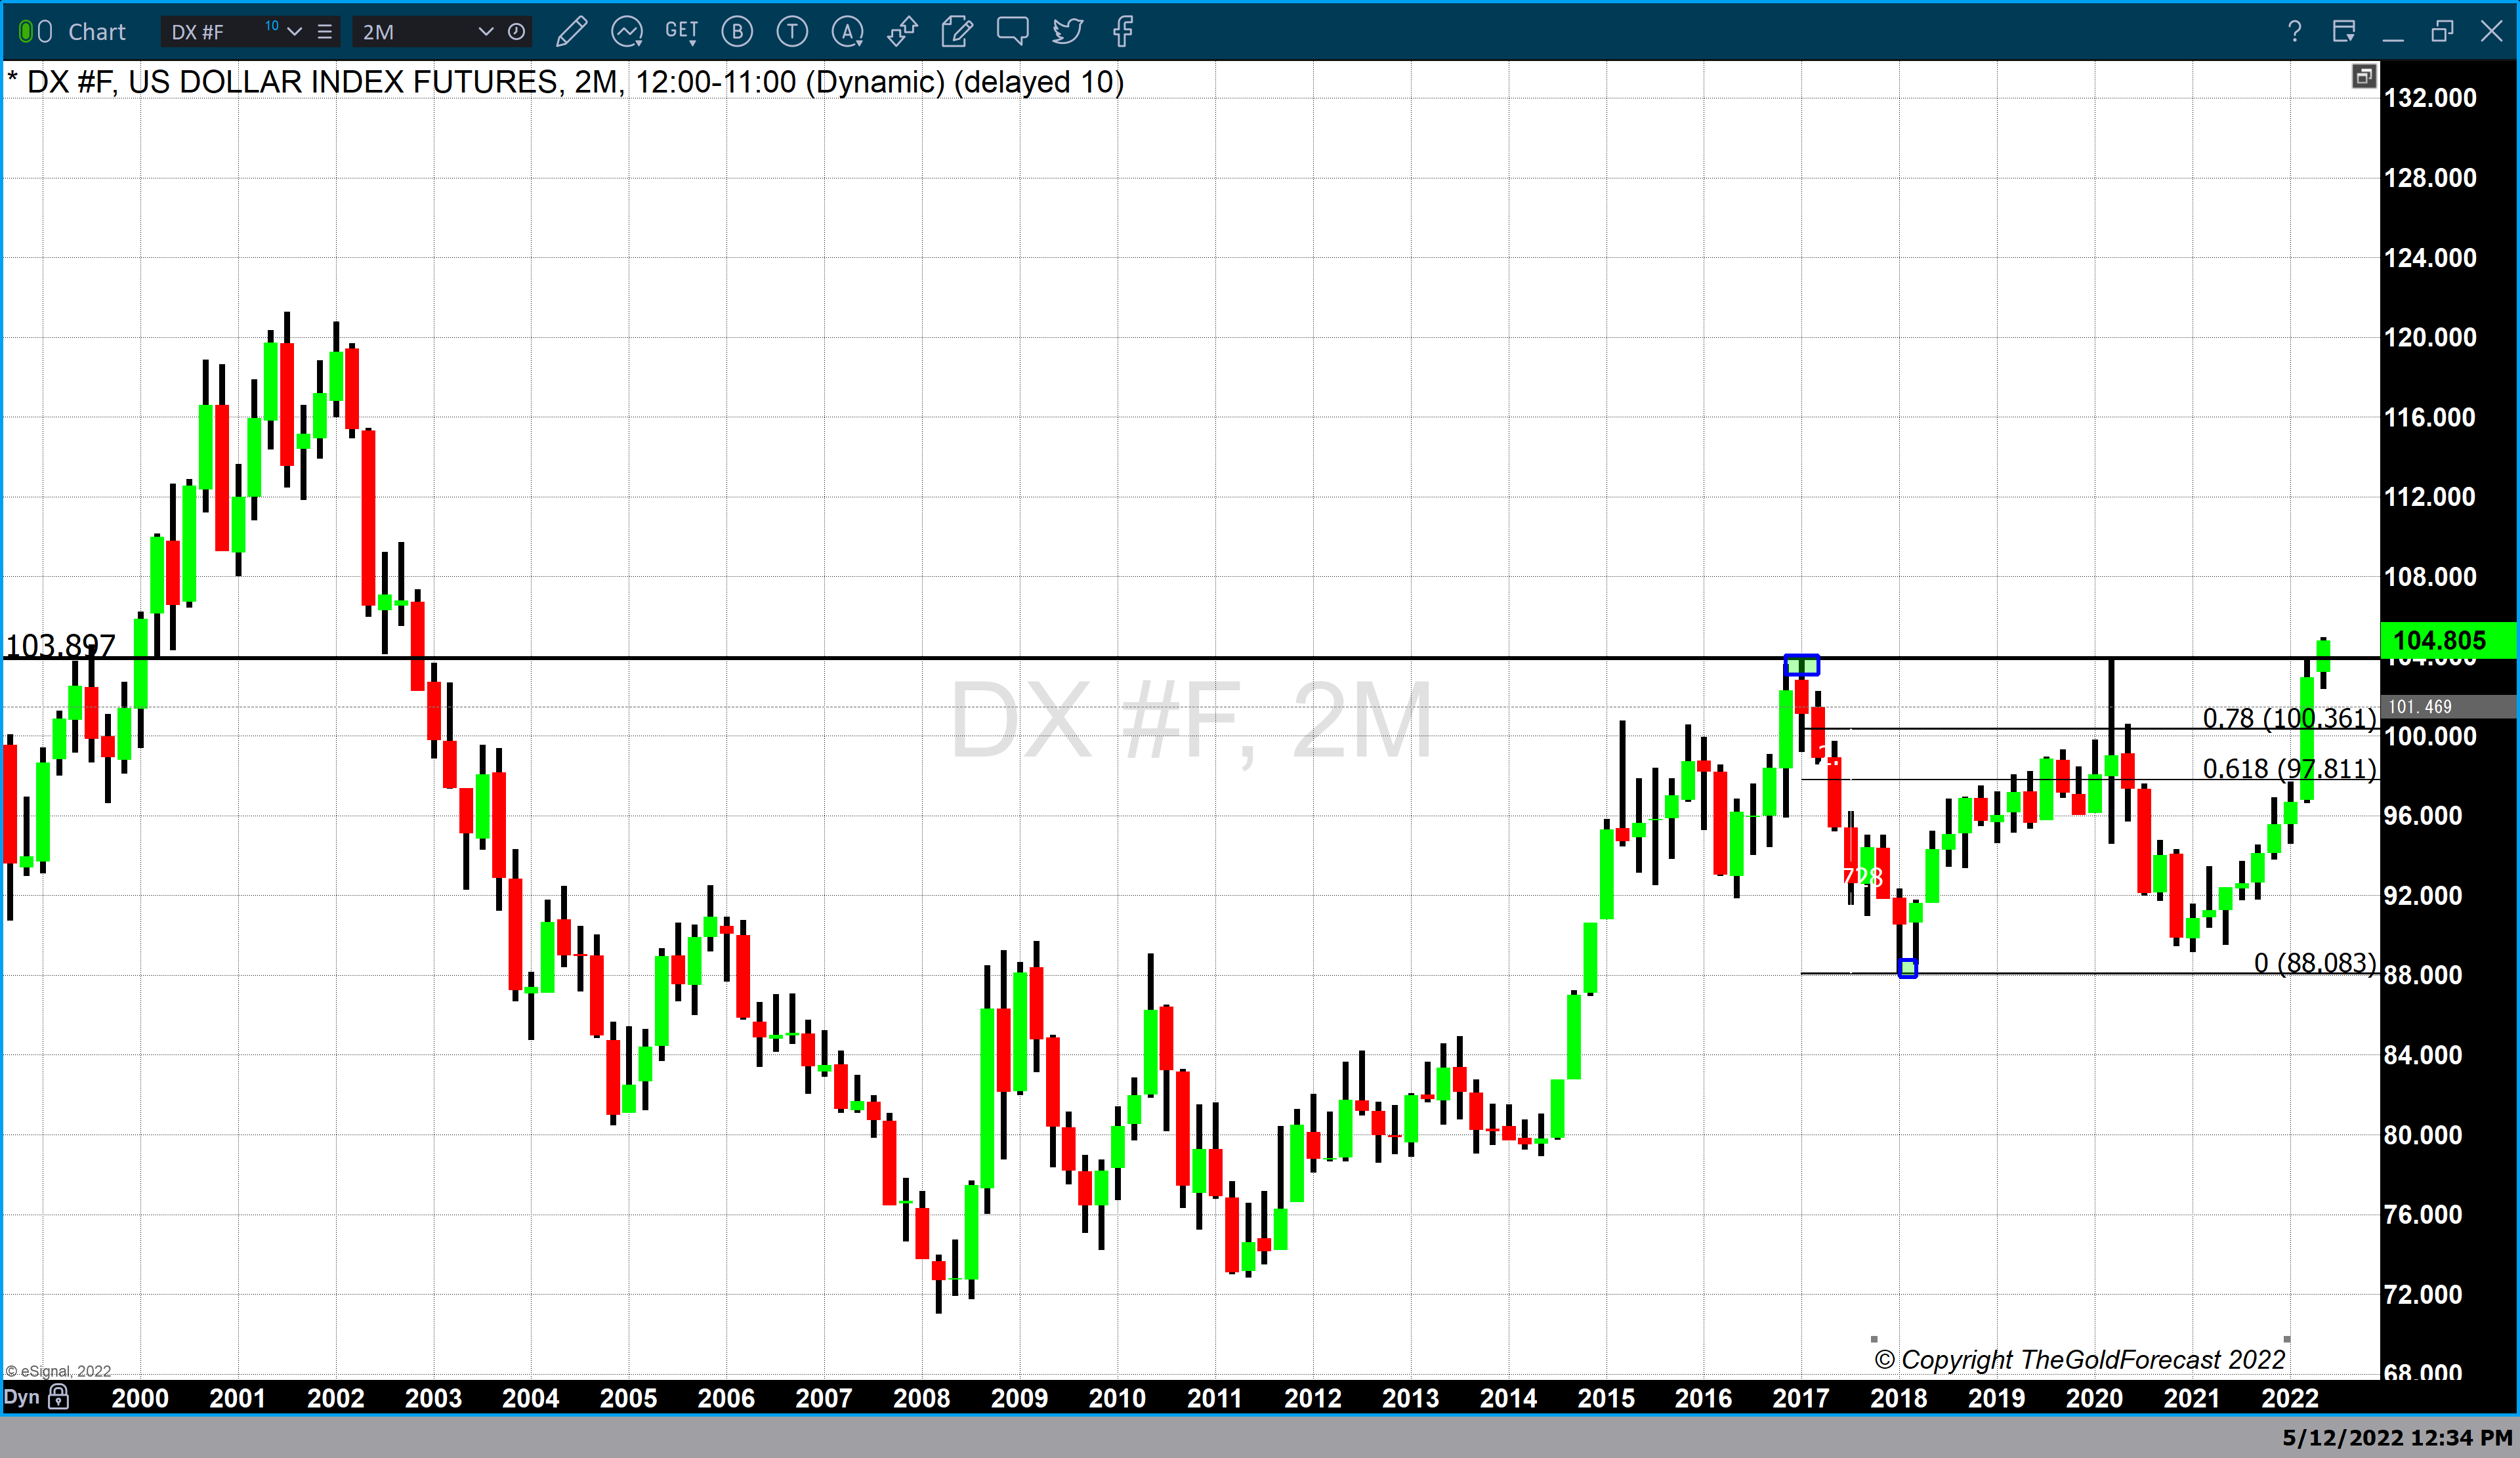
The chart above is a bimonthly dollar chart in candlestick format (two months per candle). We had to use this chart to compress the timeline enough to display the last time the dollar index traded above 103.80. Dollar strength basis the dollar index broke above solid long-term resistance that was based on a previous double top. The last time the dollar index traded above this double top was 20 years ago in 2002. Extreme dollar strength has been created as market sentiment is driven by the assumption that the Federal Reserve will become even more aggressive in terms of its rate hikes to stave off the spiraling level of inflation. Higher interest rates will result in higher yields in U.S. Treasuries which will support dollar strength.

Today’s $33 price decline in gold was based upon changes in market sentiment towards the Federal Reserve which led to not only dollar strength but also extreme selling pressure. This can be best illustrated by looking at spot gold through the eyes of the KGX (Kitco Gold Index) as seen in the screen-print above. The screen-print was taken at 5:00 PM EDT when physical or spot gold was fixed at $1821.50, after factoring in today’s decline of $31.20. However, on closer inspection, we can see that the strongest impact that led to today’s $31 decline was selling pressure. Investors and traders selling gold resulted in a decline of $18.50. Additionally, dollar strength resulted in an additional decline of $13.15.
Today’s decline in gold leads to major technical chart damage

So, the question becomes on a technical basis did today’s $33 decline result in technical chart damage. The simple answer is yes. The chart above is a daily candlestick chart of gold futures. In this chart we have two major technical studies; a Fibonacci retracement set and a 200-day simple moving average. Today’s price decline in New York trading took gold to a low of $1820. The data set used begins at $1678 from the low which occurred in August 2021 to this year’s high of $2078. Today’s price decline in gold broke below both the 200-day moving average which is currently fixed at $1836.70 and the 61.8% Fibonacci retracement which is currently fixed at $1830. The fact that gold prices broke below these two technical studies is an indication that major chart damage resulted from today’s price decline. On a technical basis should gold continues to trade lower the first level of major support does not occur till $1766 which is the 78% Fibonacci retracement.
It must be noted that this market has been driven by fundamental events and technical studies can only offer insight through technical studies which by nature are lagging indicators. I was blessed to be mentored by two great market technicians one being Larry Williams. He told me a story that illustrated the shortcoming of only using technical indicators.
To paraphrase: A market technician is analogous to someone standing at the stern of a boat and using the wake from the propeller to indicate the direction the ship was headed. While it indicated where the boat had been, only the captain knows when he will turn the wheel.
Wishing you as always good trading,

Gary S. Wagner - Executive Producer