The dollar and gold’s momentum shift as investors await GDP and PCE reports

Video section is only available for
PREMIUM MEMBERS
Investors have momentarily shifted their attention away from the geopolitical crisis in the Middle East to focus on two important reports. Beginning on Thursday at 8:30 AM EDT, the government will release a series of reports, with the most important component being the latest GDP for the third quarter (Q3). That report will be followed by the PCE (Personal Consumption Expenditures Price Index) for September. The current forecast of the core PCE index is looking for an increase in inflation from 0.1% to 0.3% month over month.
This can be seen in the recent price action in both the dollar and gold as both markets consolidate as investors wait for this critical data.
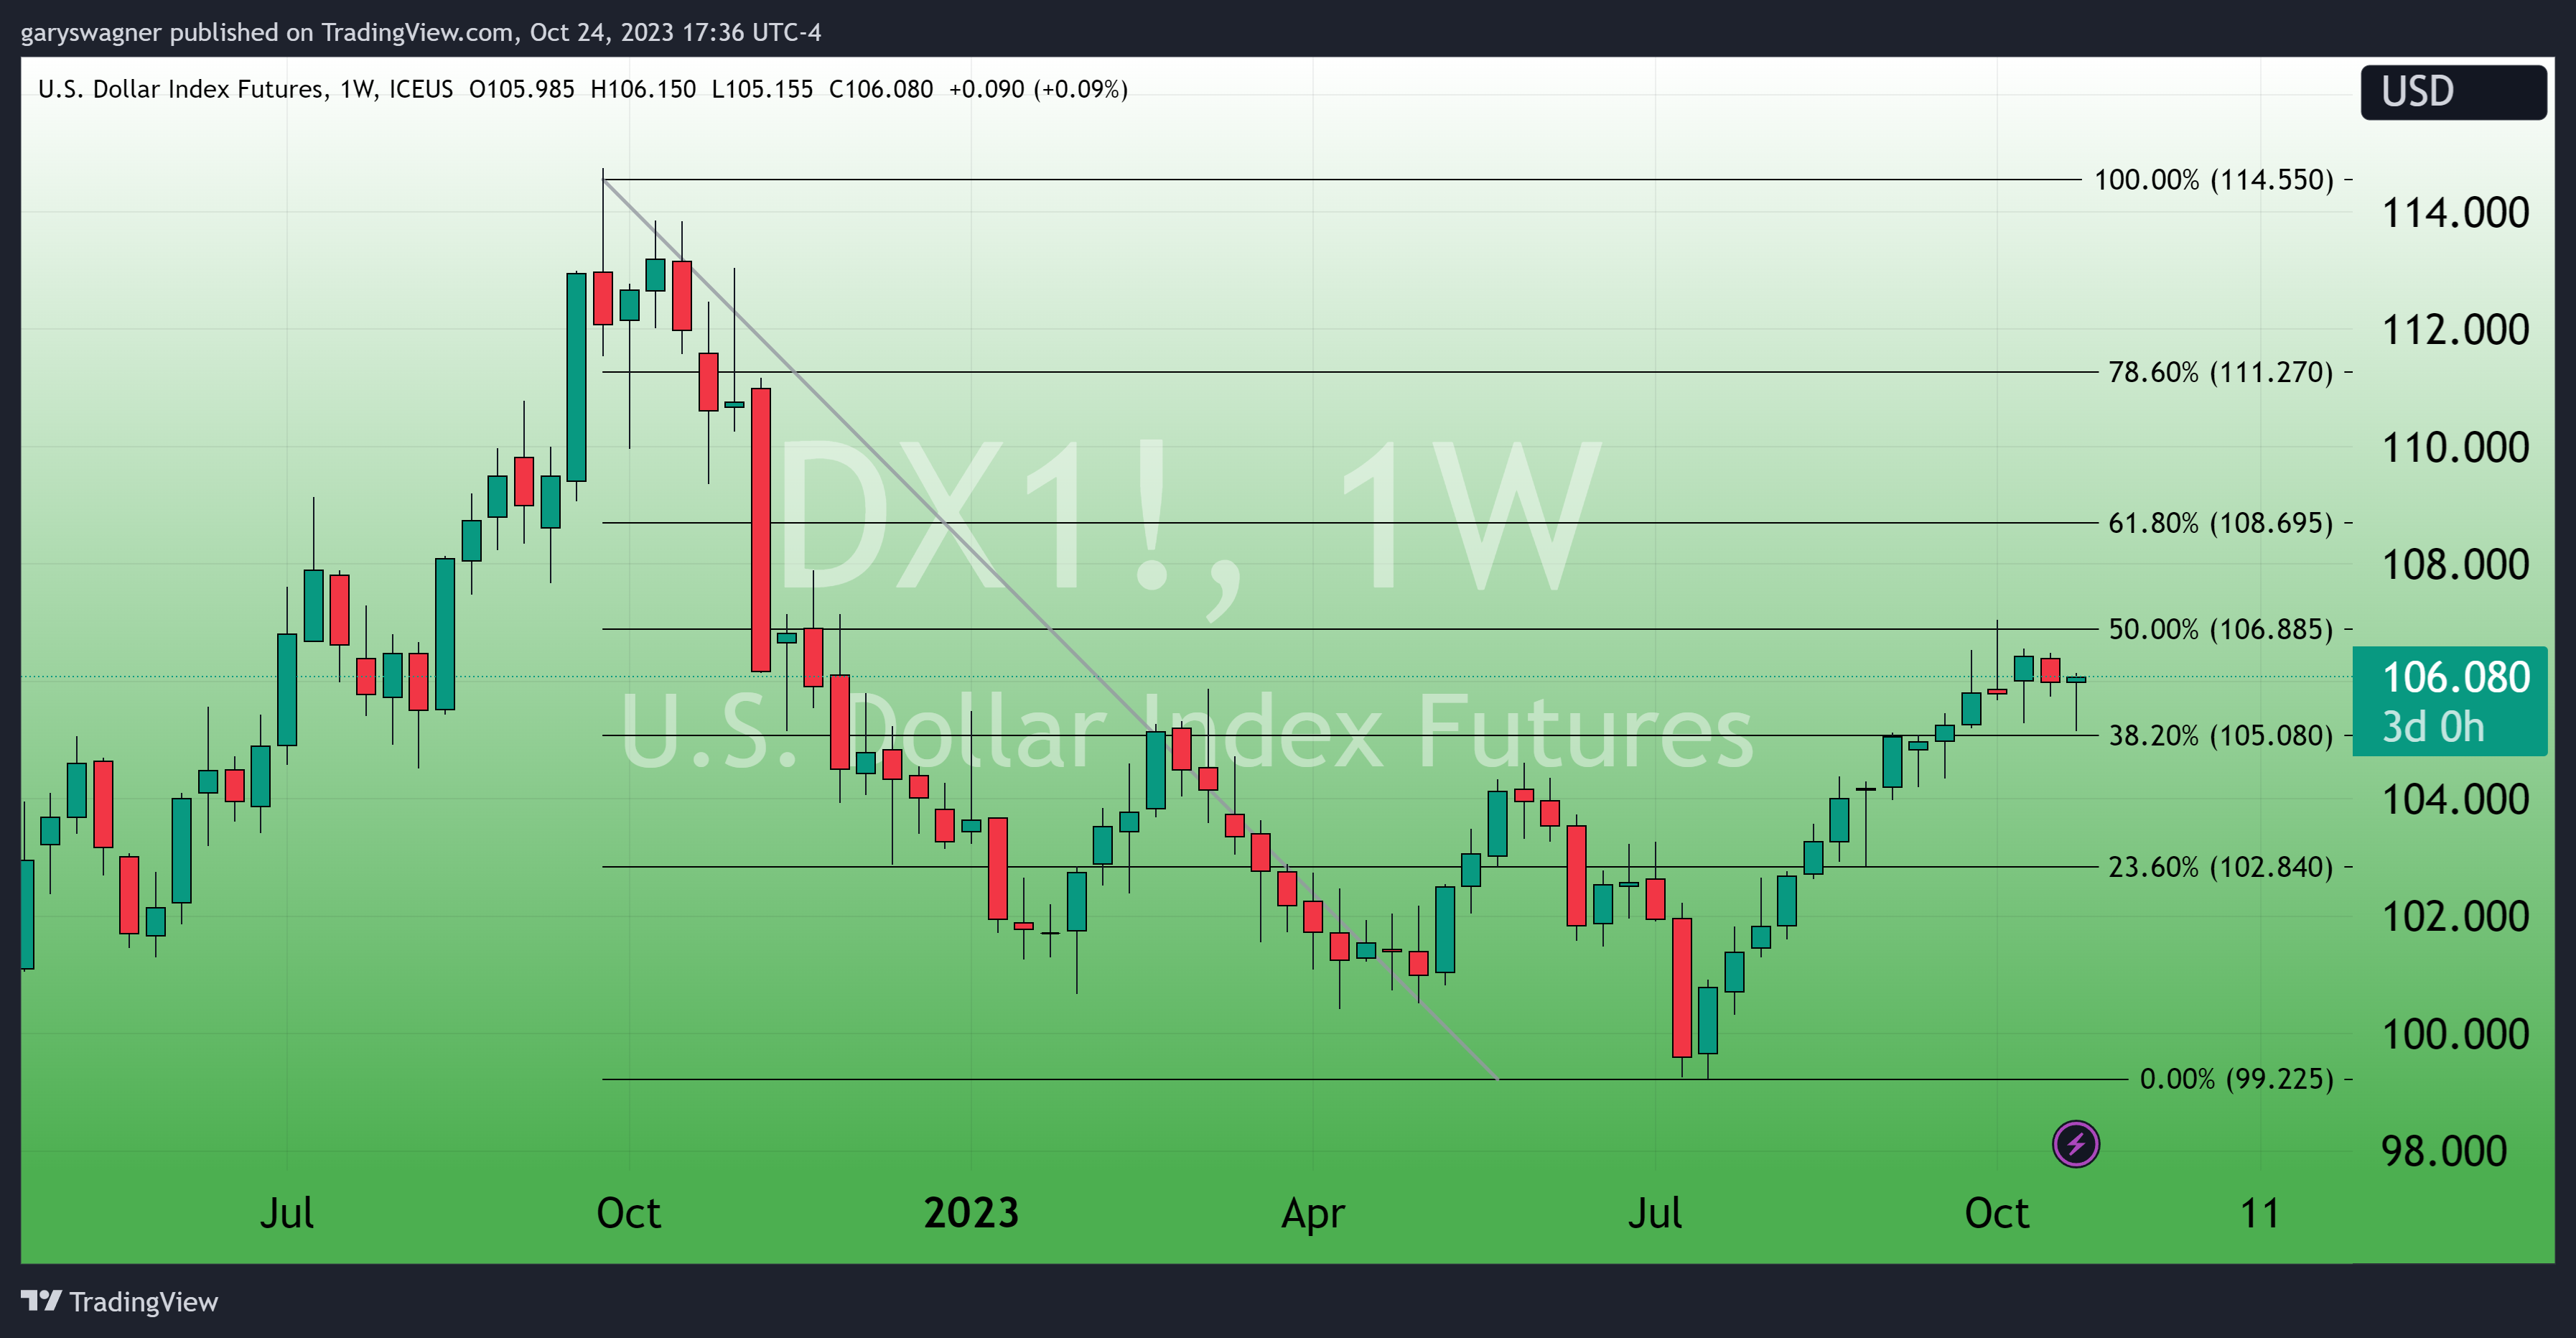
The U.S. dollar index opened at 105.39, traded to a high of 106.13, and a low of 105.15. Currently, the dollar index is up +0.71% (0.745 points) and fixed at 106.08. The chart below is a daily Japanese candlestick chart of the dollar index. We have created a Fibonacci retracement utilizing a data set beginning at the high of 114.50 achieved on September 27, 2022, to the low of 99.225 which occurred on July 18. Recent intraday lows indicate that the first level of short-term support is at the 38.20% Fibonacci retracement at 105.08. Short-term resistance can be identified from price tops that occurred during the first week of October at approximately 106.85, which corresponds to a 50% retracement of the long-term data set used for this retracement sequence.
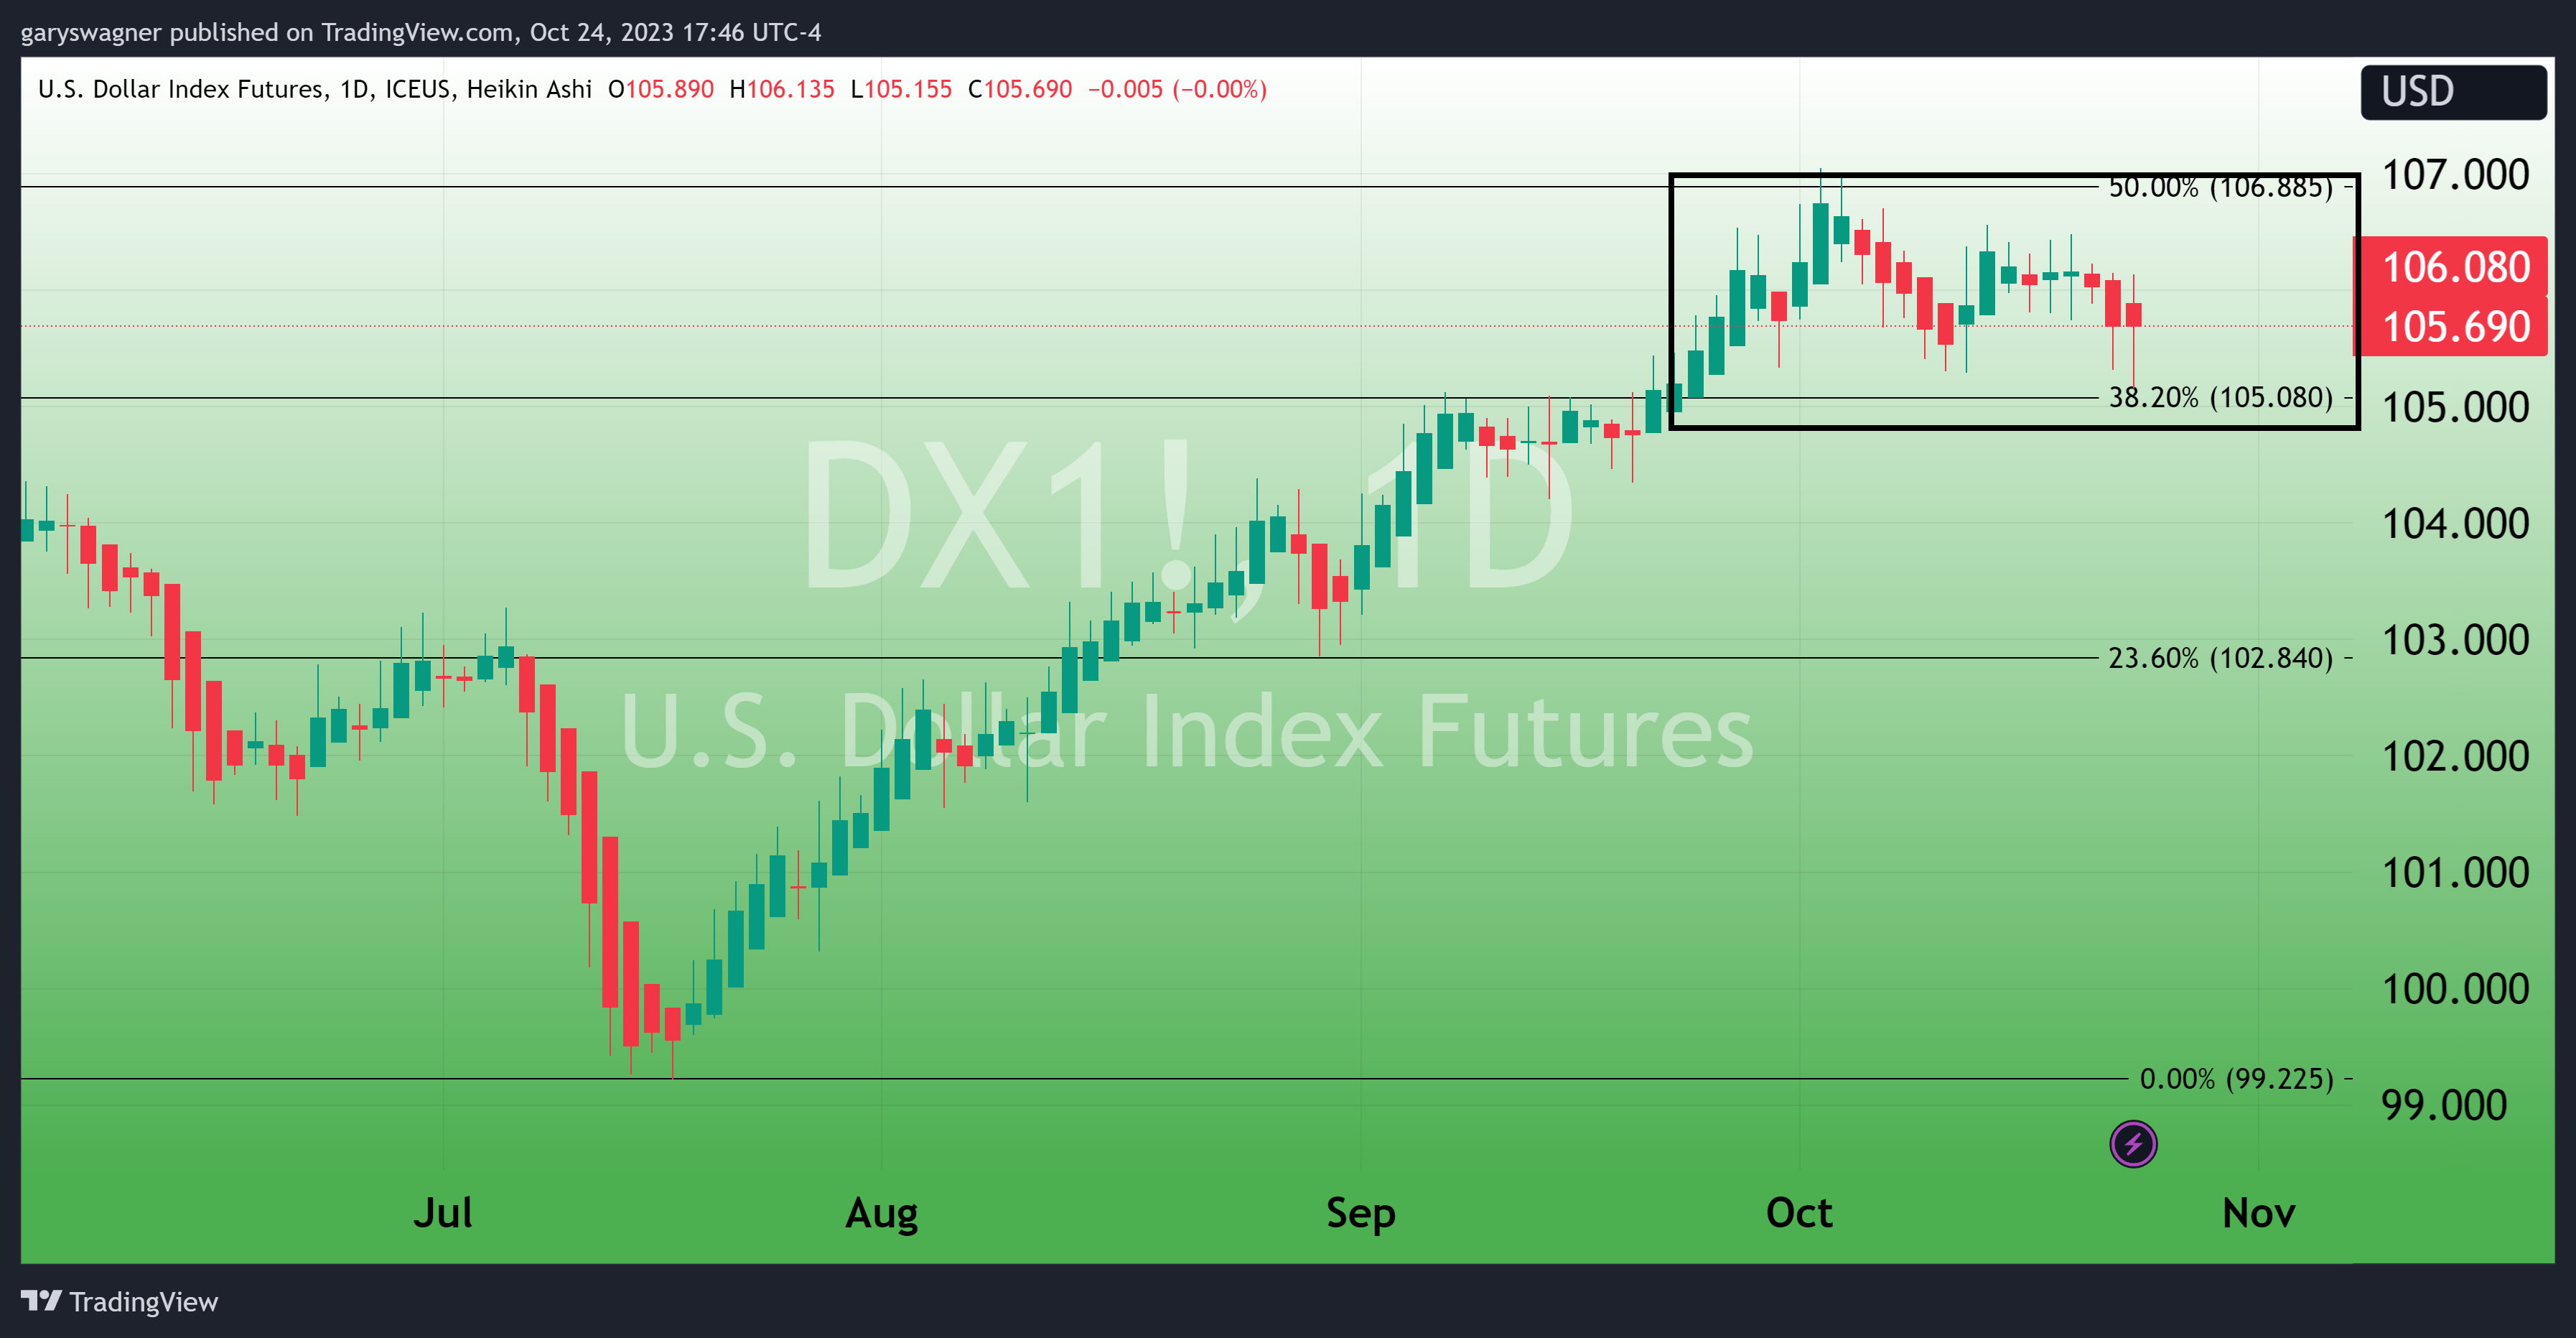
Despite recent dollar strength, the chart below which was created from daily data and viewed through a Heikin Ashi Chart (Japanese Average Chart). Recent data indicates that the strong uptrend that began in July has hit a formidable area of resistance. This can be confirmed because of the color oscillation between red and green candles, smaller real bodies, and lastly upper and lower wicks on both colored candles.
The Heikin Ashi format, also known as a Japanese average chart, is used to filter out market noise. Market noise defined by Will Kenton is, “In a broad analytical context, noise refers to information or activity that confuses or misrepresents genuine underlying trends. In the financial markets, noise can include small price corrections in the market as well as price fluctuations–called volatility–that distorts the overall trend.”
Unlike a candlestick chart, which uses the true opening price, the Japanese average chart creates the open from the midpoint of the prior trading session. It is an exceptional chart style to indicate the strength of the trend, as well as pivot points. It also removes the noise as it creates a chart with prolonged cycles of all green or red.
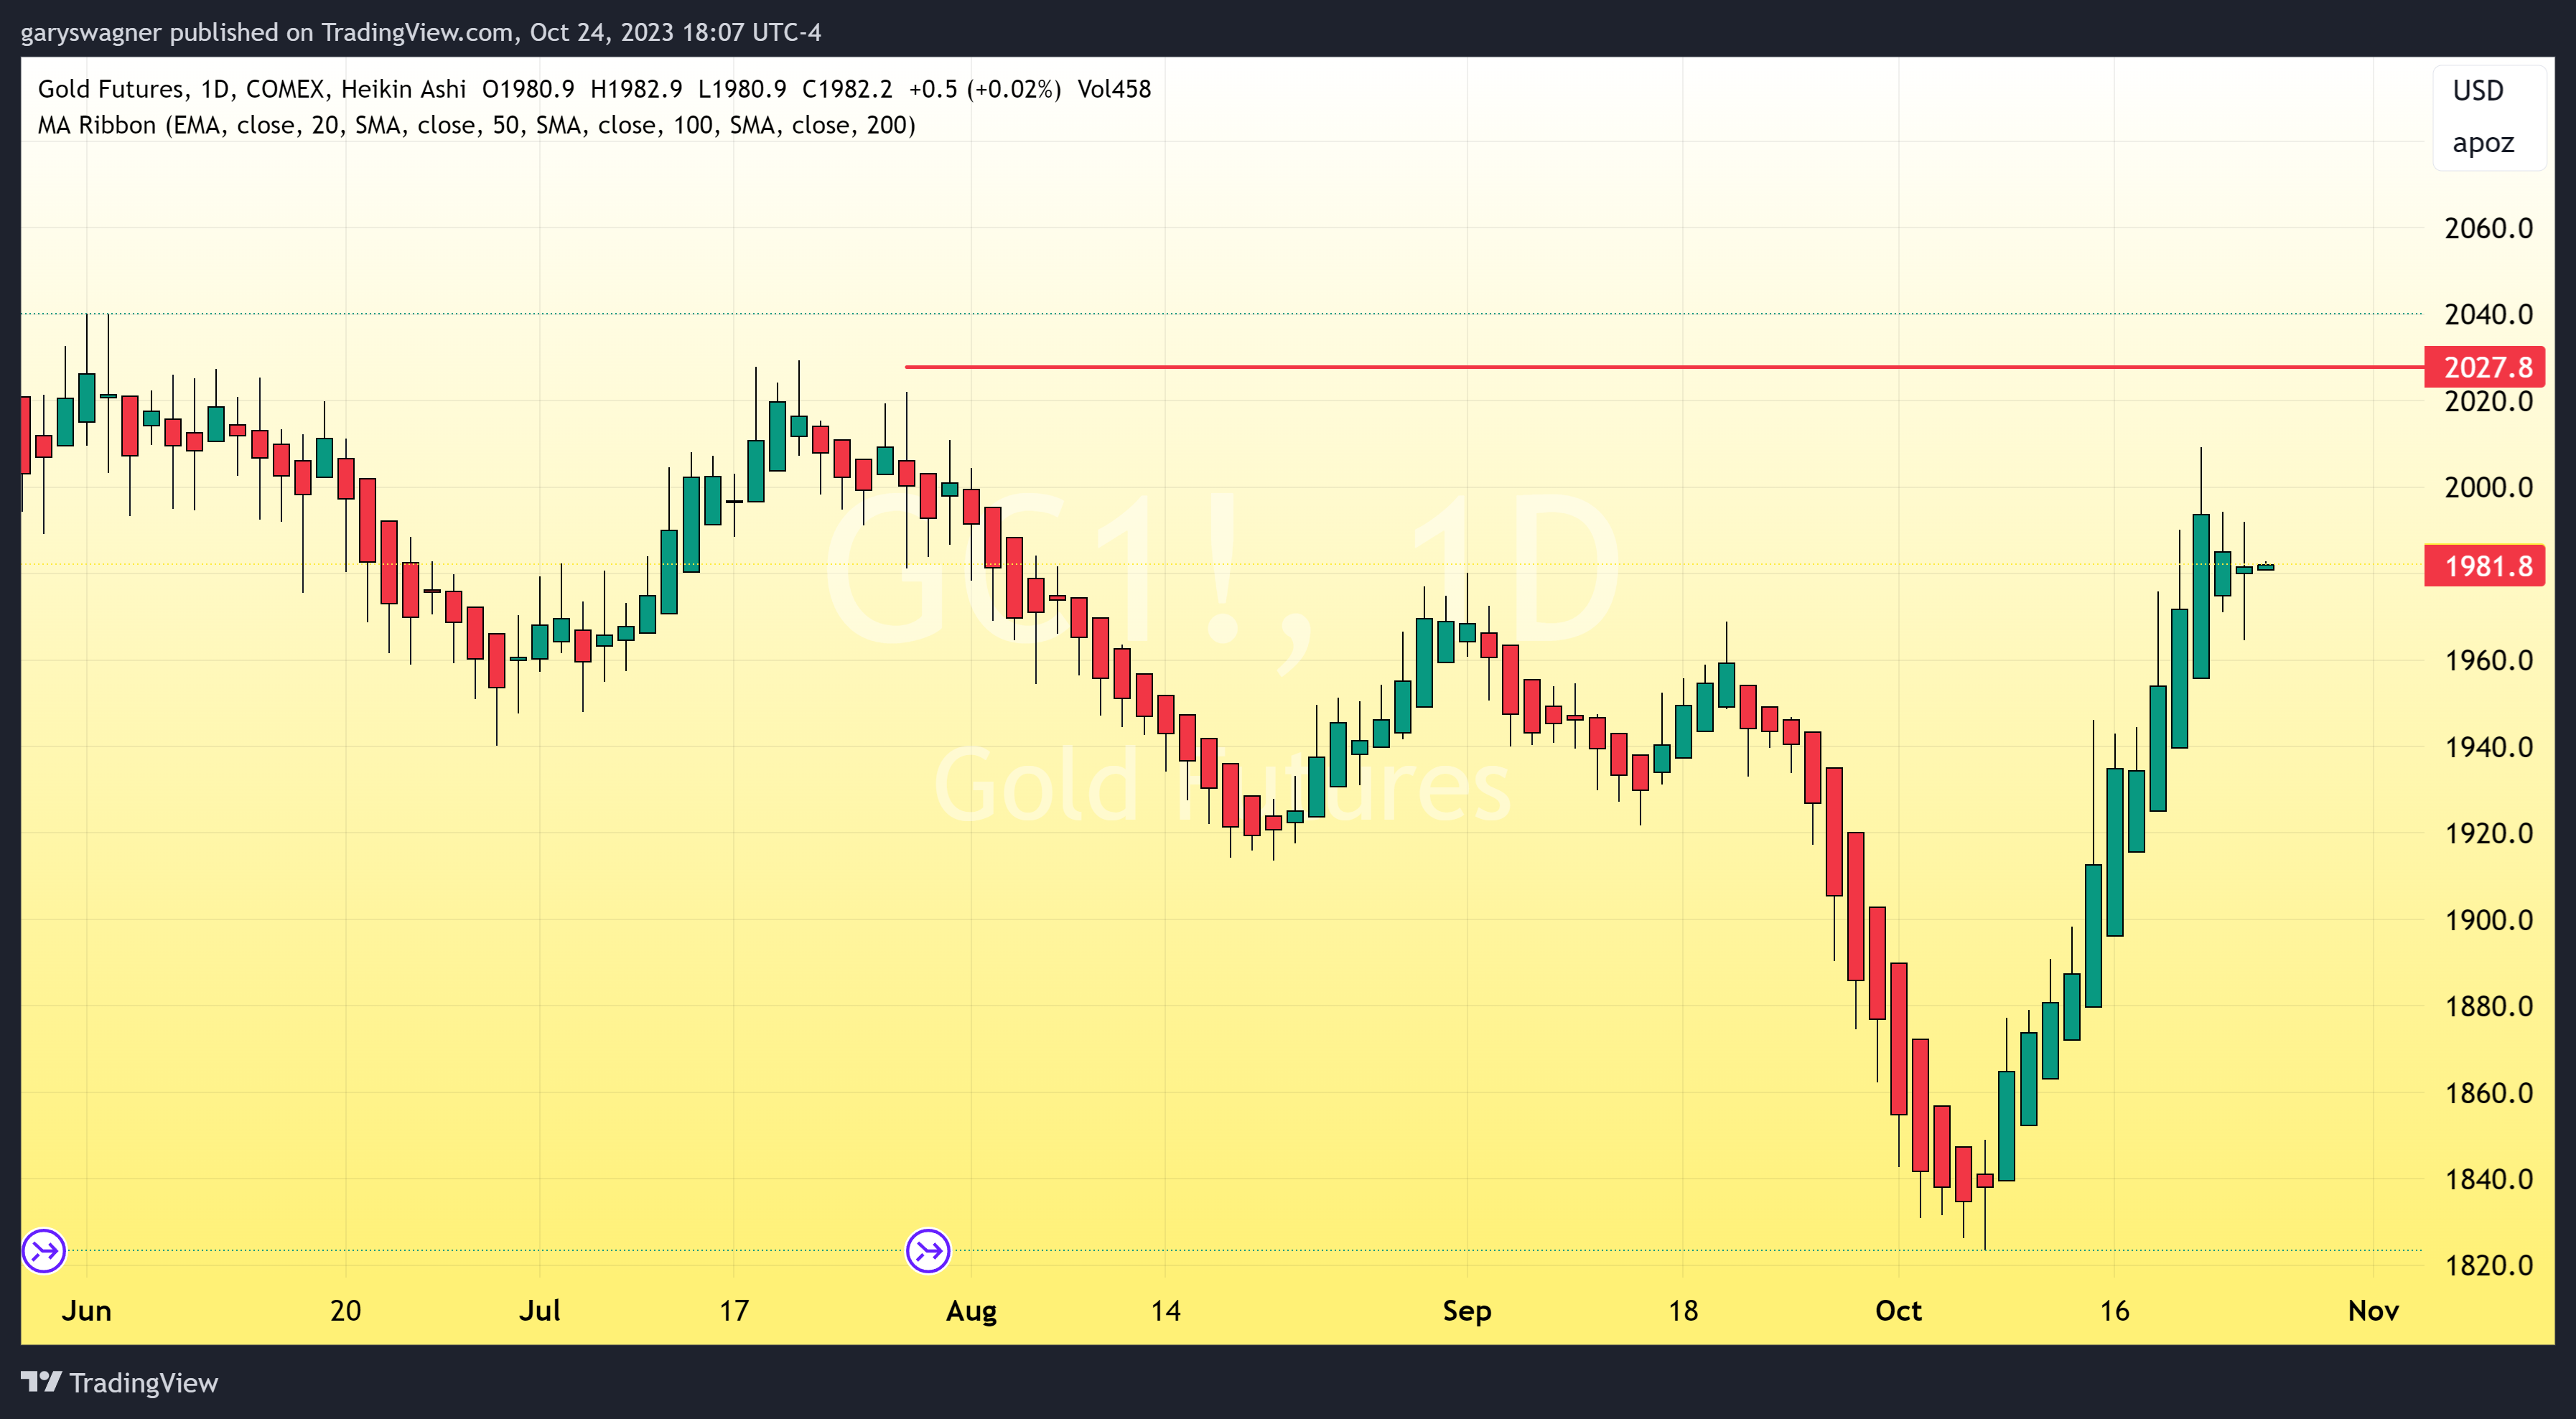
The chart above is a daily gold chart in Heikin Ashi format. Body size has greatly contracted over the last three trading days. Recent candles also contain upper and lower wicks. Technically, there is no major resistance until $2020 based upon a top that occurred during the third week of July. Recent price consolidation can be viewed as a reflection of market participants focusing on the latest information on inflation as well as GDP.
Wishing you as always good trading,

Gary S. Wagner - Executive Producer