Bitcoin’s bullish and bearish cases

Bitcoin continues to hold above $60,000 today marks the beginning of its third week above this key price level and the sixth week to close above it. As shown in our chart below this price point (horizontal blue line) was absolutely definitive resistance during the previous rally in Spring of this year as there was not a single weekly close above $60k. In March, April, and May of this year, Bitcoin failed to close out a week above $60k, and after the seventh unsuccessful attempt tumbled down to $30k in less than two weeks.
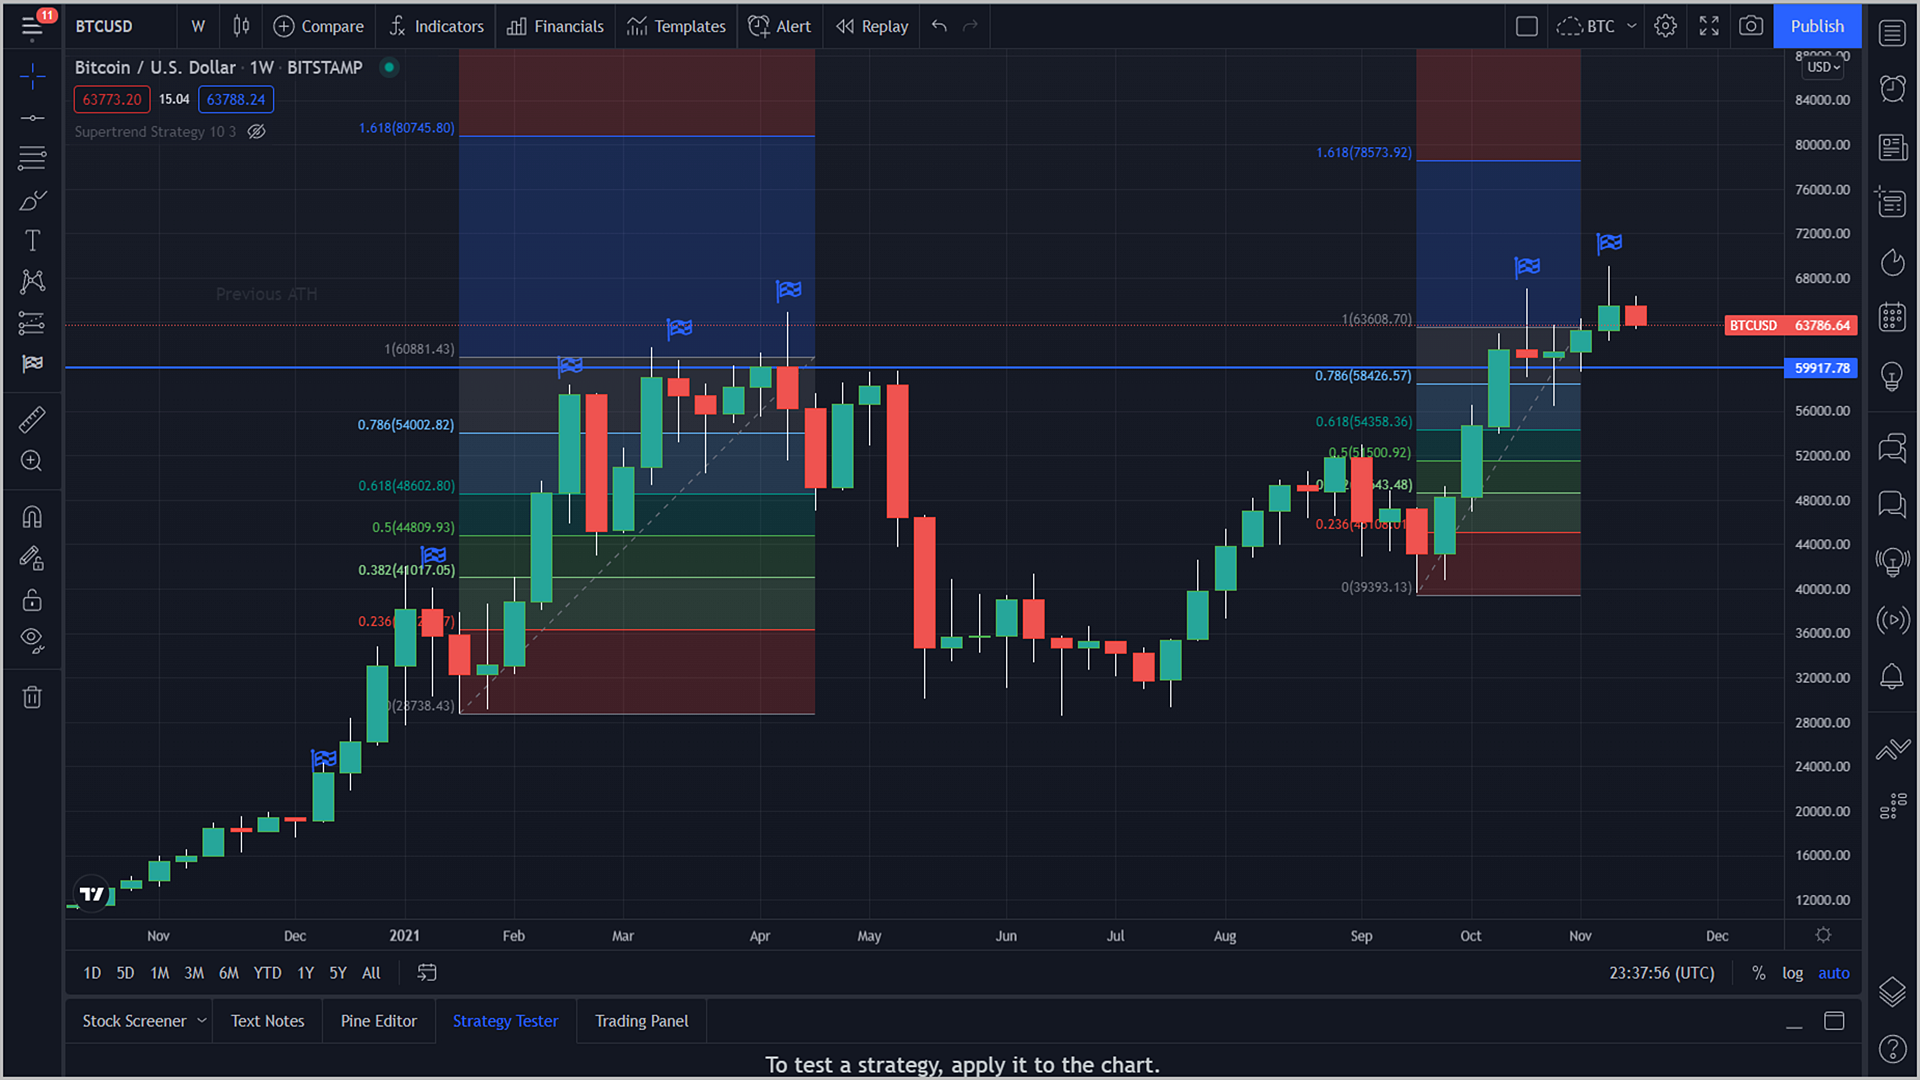
Another bullish technical finding is visible in the chart above, and that is based on wave three Fibonacci extensions of wave one. A rule of thumb used in Elliot Wave Theory is that in a bullish five-wave cycle, either wave three or occasionally wave five will typically extend to a 1.618 extension of wave one. We can see that clearly illustrated in the rally from this Spring, where the 1.618 extensions of wave one ($62,000) were only breached on an intra-week basis. If we perform the same comparison of waves one and three of our current wave count, we see the 1.618 extension comes in at $68,713. Just as in the previous rally this level has been pierced only once on an intra-week basis. This is a definingly bearish indication, and even though it is not definitive should be noted, and if we don’t break above $70k this week I would be looking for lower prices. If this plays out, I see $44,000 as solid support for a steep correction.
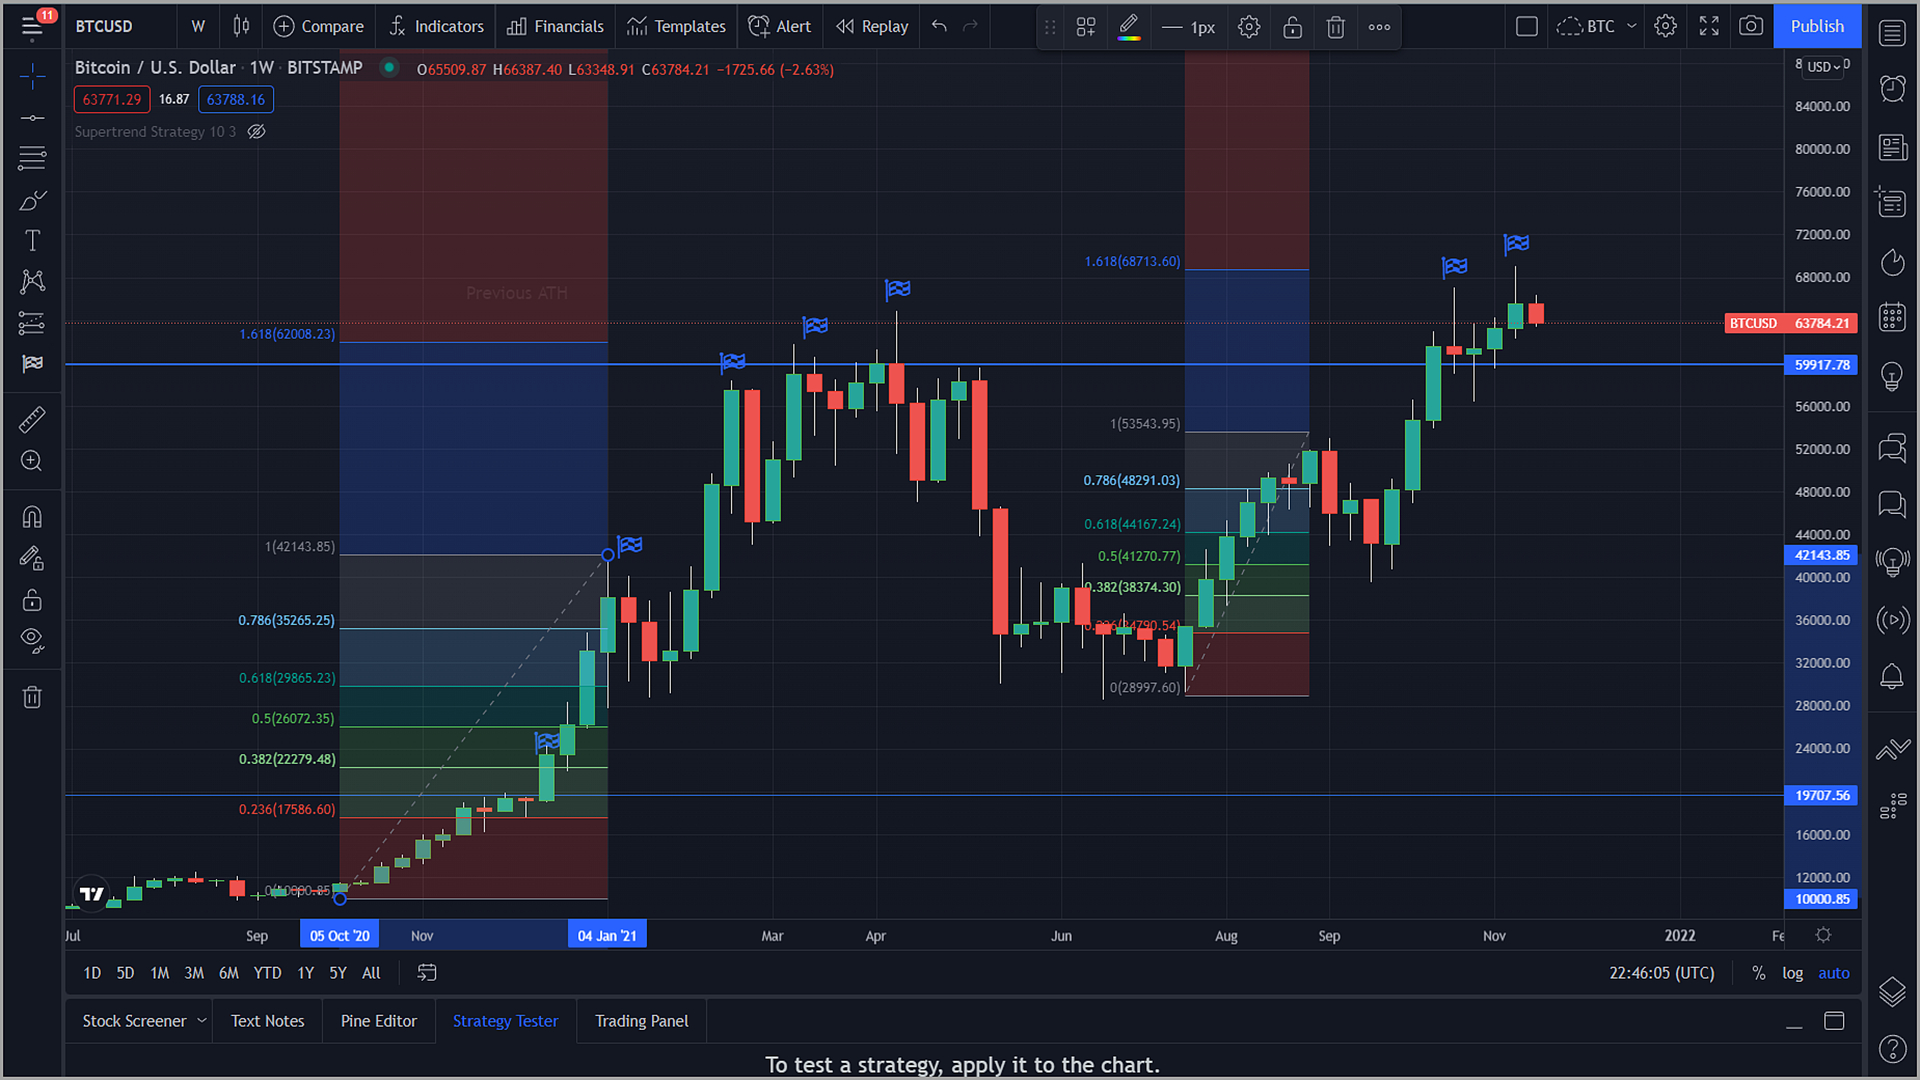
This ominous technical warning that we may have reached the apex of the current rally can also be seen by taking the same extensions and moving both to the end of the previous corrective wave (2 or 4 in a bull count) and when we do this what is revealed is that a one-to-one relationship from the previous impulse wave correctly predicted the last apex in Spring meaning that waves three and five were equal.
When we perform the same comparison on the current run-up, we see that a one-to-one correlation is defining our current support level at coming in at $63k. Also, for the bullish case, our price target of $75k-$80k is squarely supported by the 1.618 extension at roughly $78,500.
So, with both bull and bear cases laid out, the bull case remains more likely to play out. However, if we don’t break $70k this week than the bearish scenario is probable.