The most accurate metric for predicting significant moves in BTC; market dominance

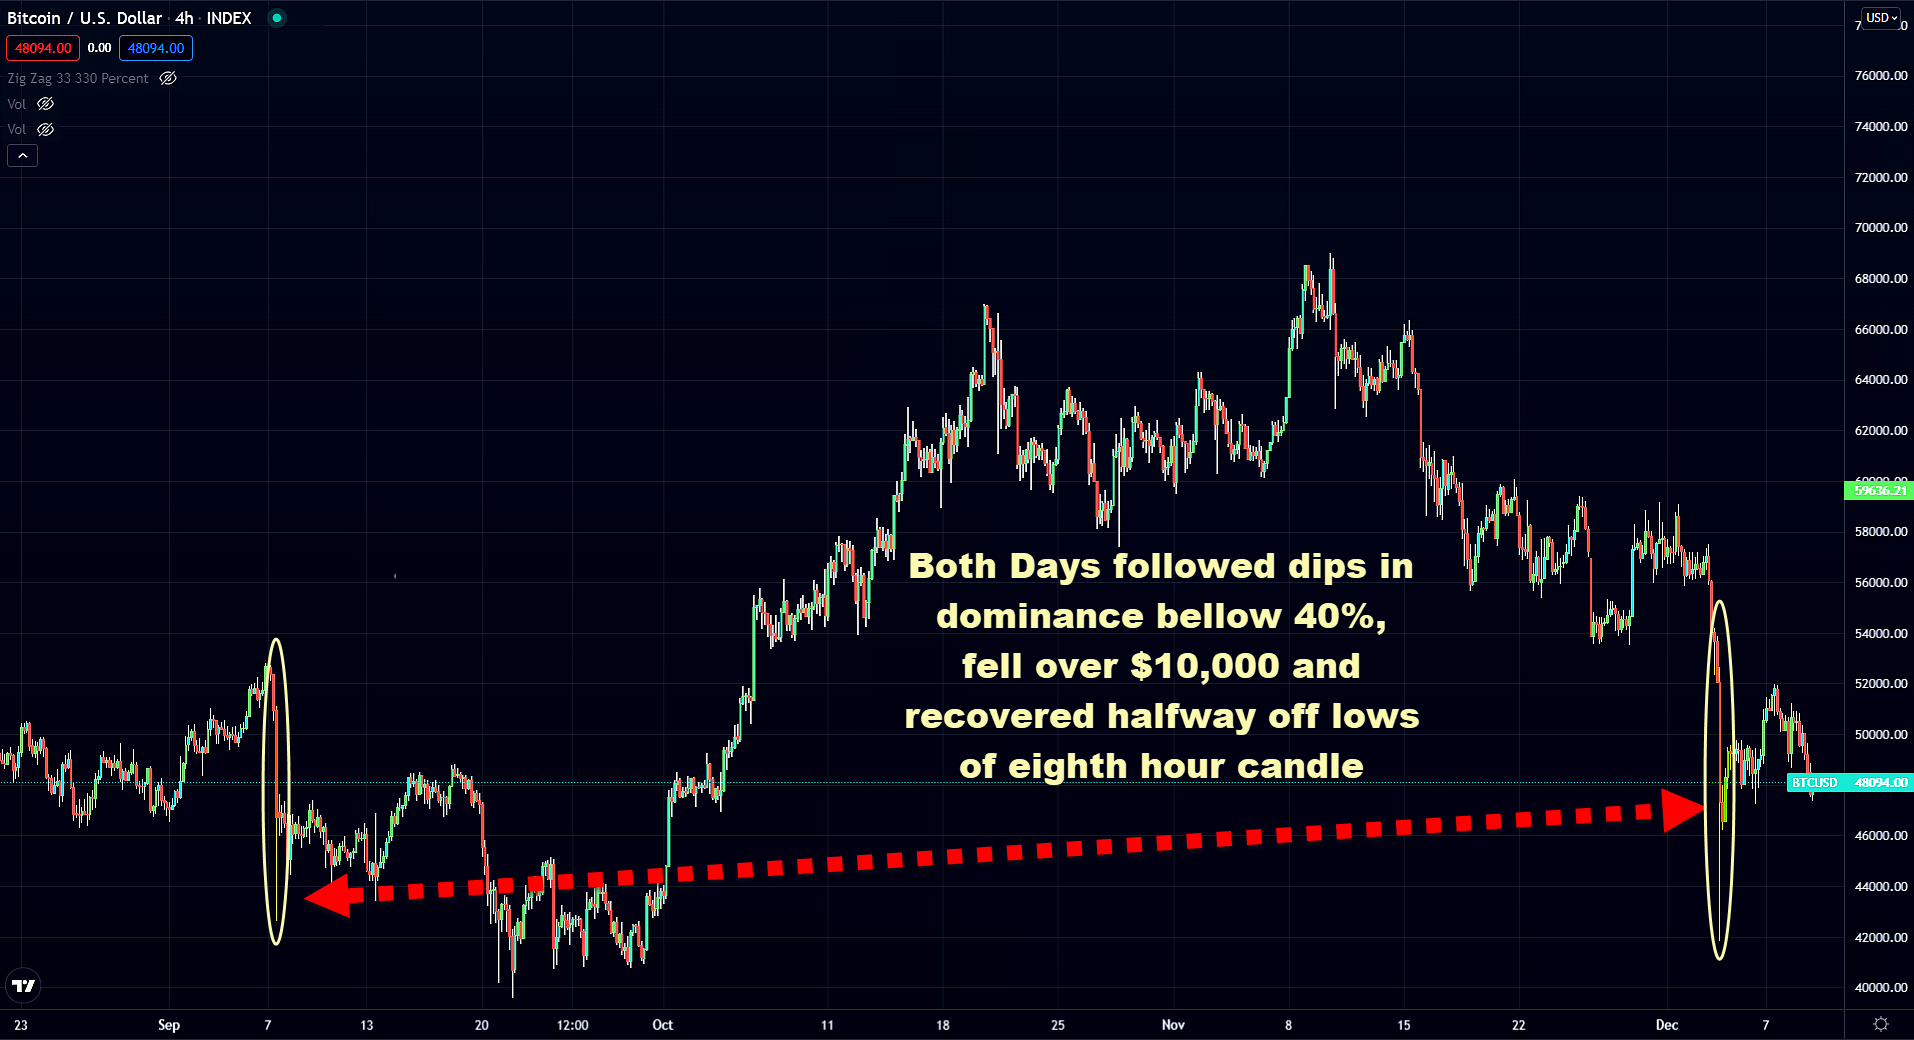
Following Bitcoin’s brief tumble over the weekend took out a critical support level that had managed to hold for the week prior. The number one digital asset by market capitalization experienced a true flash crash after breaking the key 61.8% Fib. level ($53,600) on Dec 3rth. In the first eight hours of Saturday, December 4th, Bitcoin plummeted by $11,000, reportedly printing on some exchanges as low as $28k. Two hours later, Bitcoin had effectively reclaimed $5,000 of its losses. At the start of this week, pricing was consolidating underneath $50k. By mid-week, pricing had recouped $50,000 and the 50% retracement level.
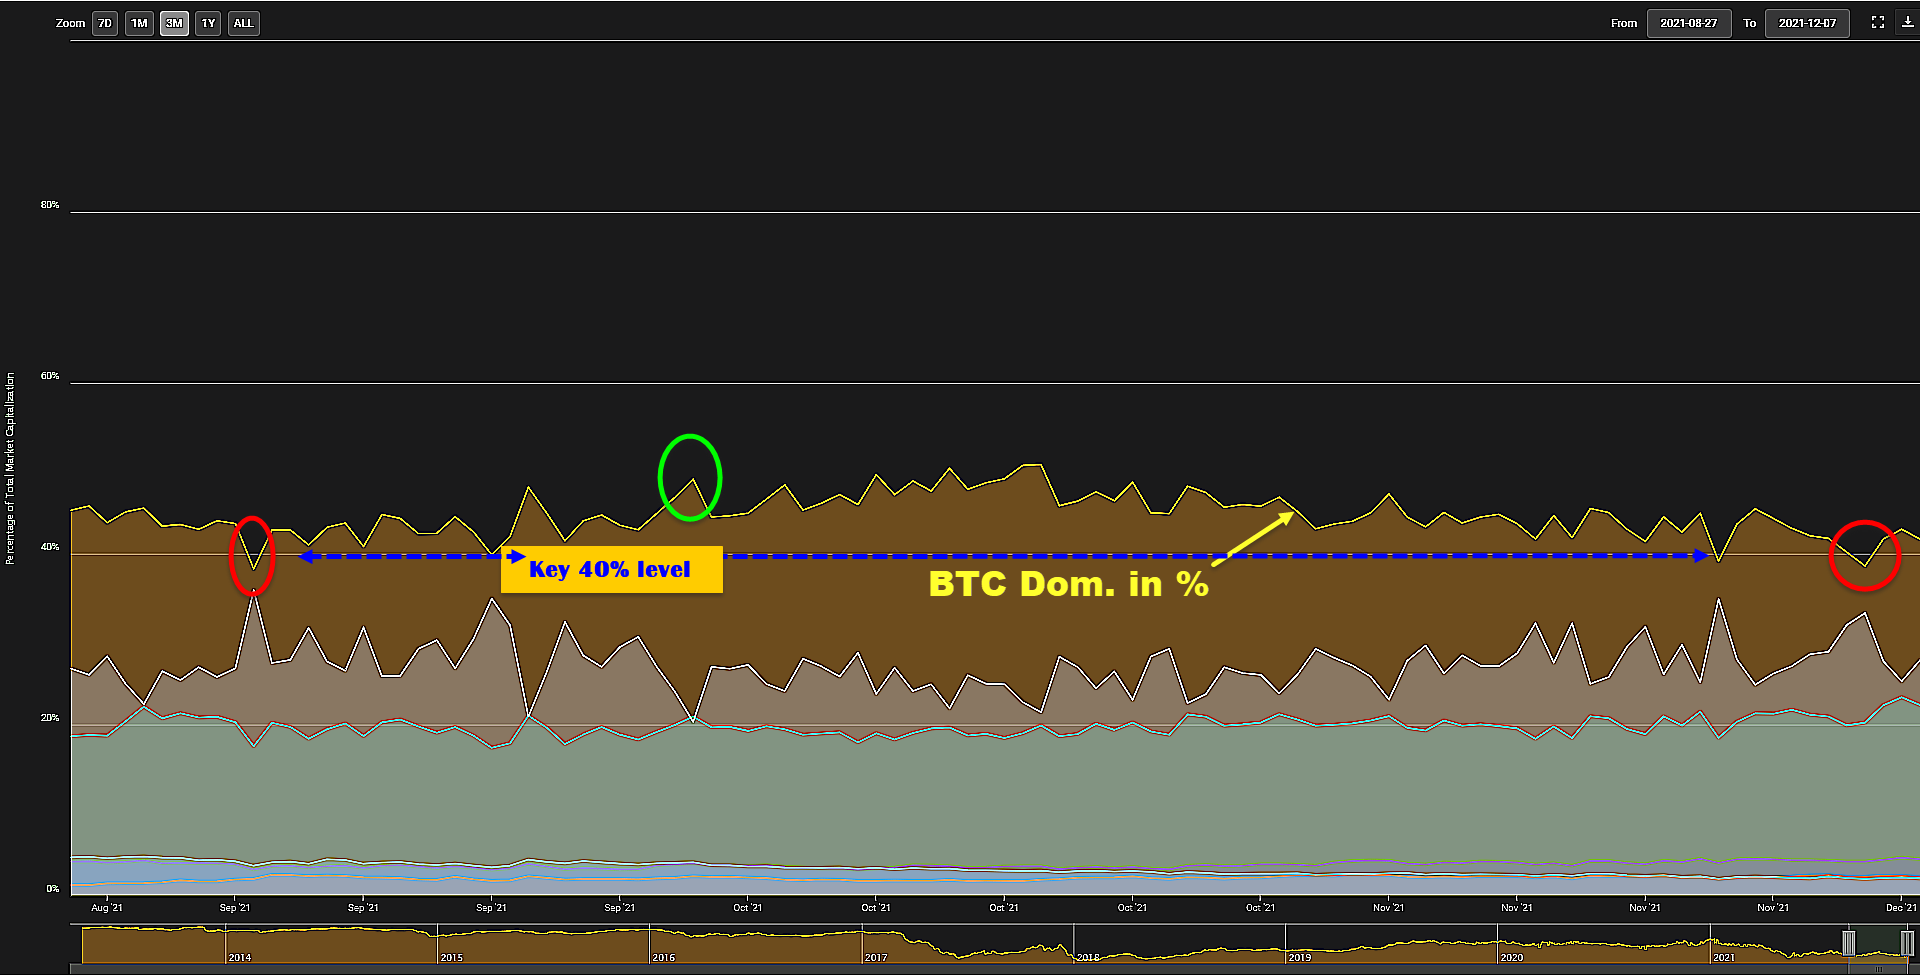
I will show you how to predict future swings in the market can be effectively foreseen by simply utilizing a single metric. This metric is Bitcoin’s market dominance which dipped to roughly 38% on December 3rd. This level dipping beneath 40% has been spot-on accurate in predicting a price decline the following day.
On November 25th, the dominance of BTC briefly dipped to under 40% pricing fell from just below $60k to support at $53k the following day. On Monday September 6th, dominance fell briefly below 40%, the following day Sep. 7th pricing experienced exactly what happened this weekend, losing $10,000 of value the first eight hours of trading while recouping $5,000 in the eight-hour creating a candle with an extremely long lower wick representing an exaggerated low.

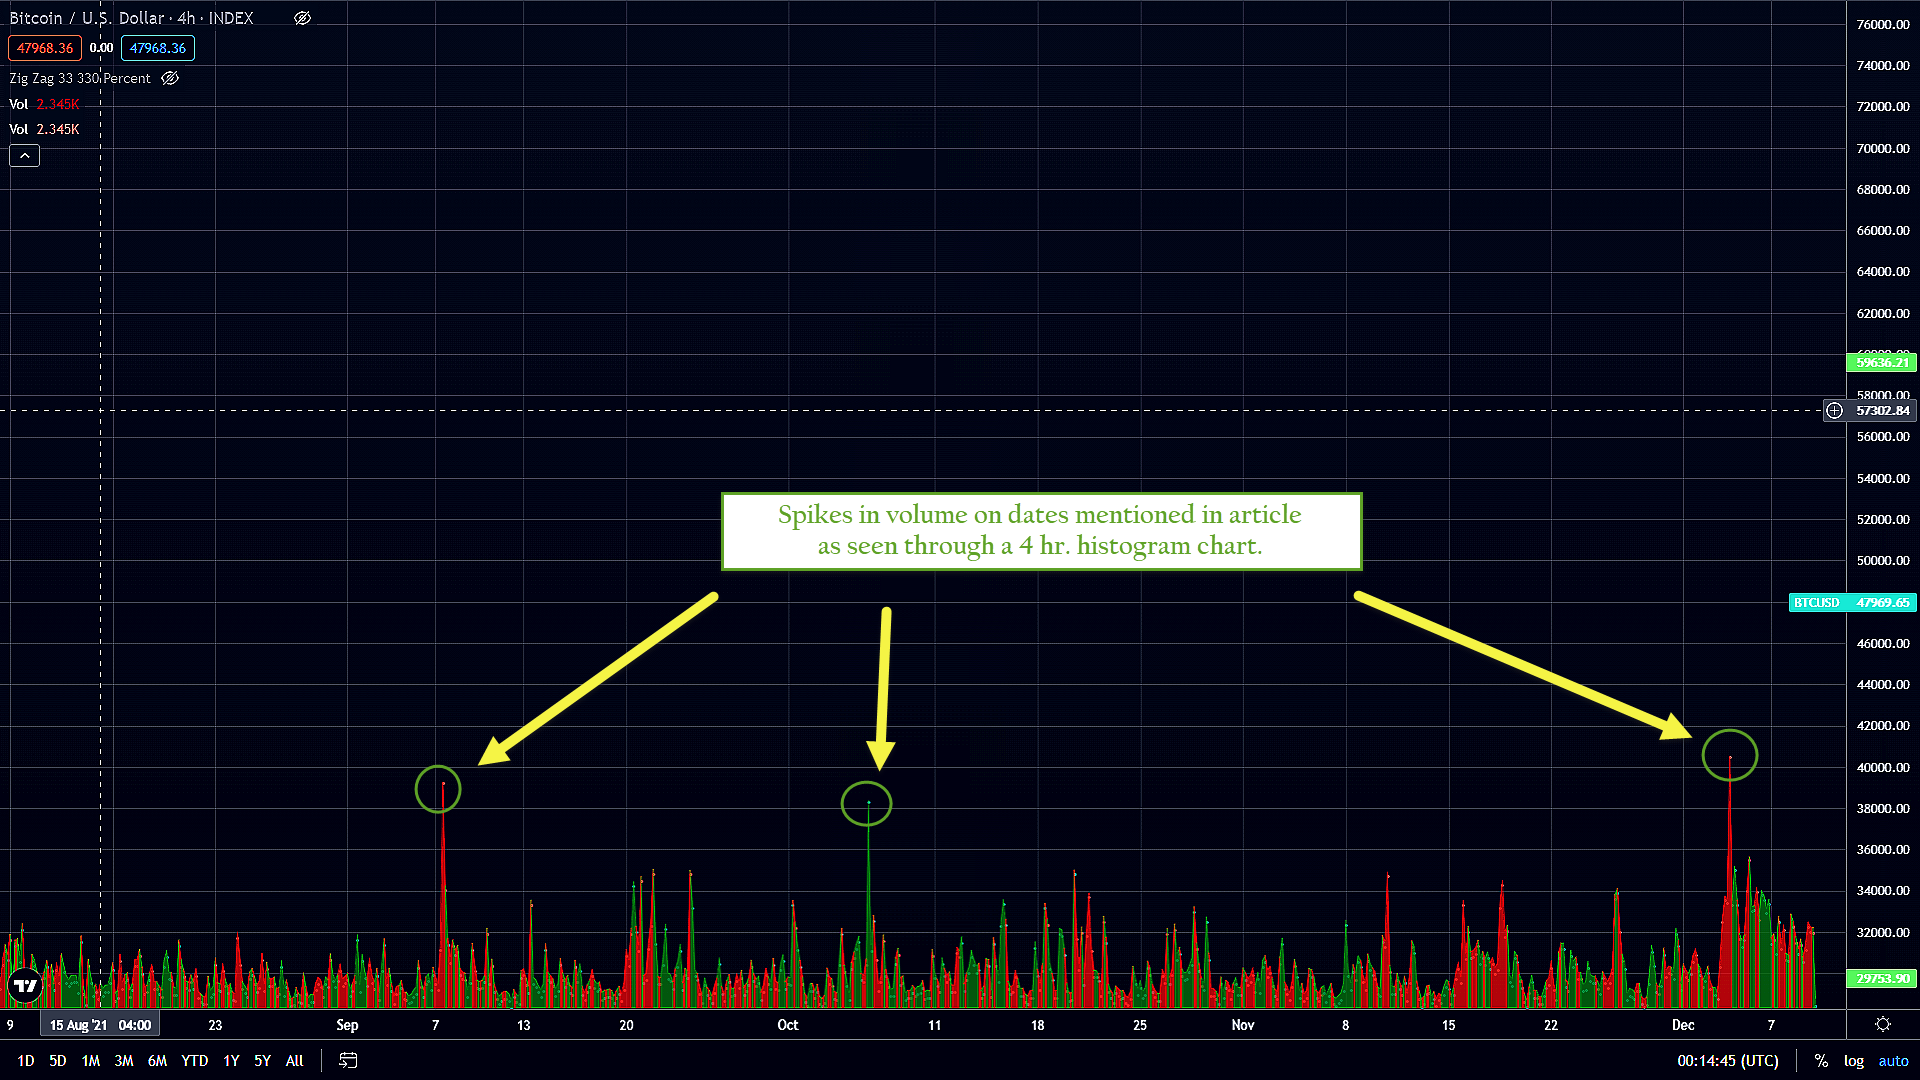
Trading volume can also be used in the same way to predict these swift price moves in Bitcoin. For example, on both occasions, we are claiming the dominance metric predicted precisely when an exaggerated sharp drop would occur (September 6th and December 4th), the trading volume experienced a massive spike. In both cases, they marked volume reaching 6-month highs expanding 10-fold from an average of 2.5k every 4-hrs. to over 20k. In both cases, this was only a short intra-day increase; however, on the recent occurrence levels did not return to below 3k on a 4-hour time frame and they remain elevated currently around three times above normal levels for 2021.

This incredibly insightful metric can be used to predict bullish moves as well. On October 5th, Bitcoin’s overall dominance of the entire crypto sector spiked to 48%. The following day, on October 6th, Bitcoin was able to take out the critical area of resistance/support at $53k for the first time since breaking below it on May 12th. This also shows up on a 4-hr. time cycle as a brief spike in trading volume that shot up by nearly ten times the average level and would be a 6-month high but fell just shy of the above-mentioned surges reaching 18.9k in a 4-hr. window.
