Supercycle in Bitcoin?

C:\> FC
BTC2017.txt BTC2021.txt
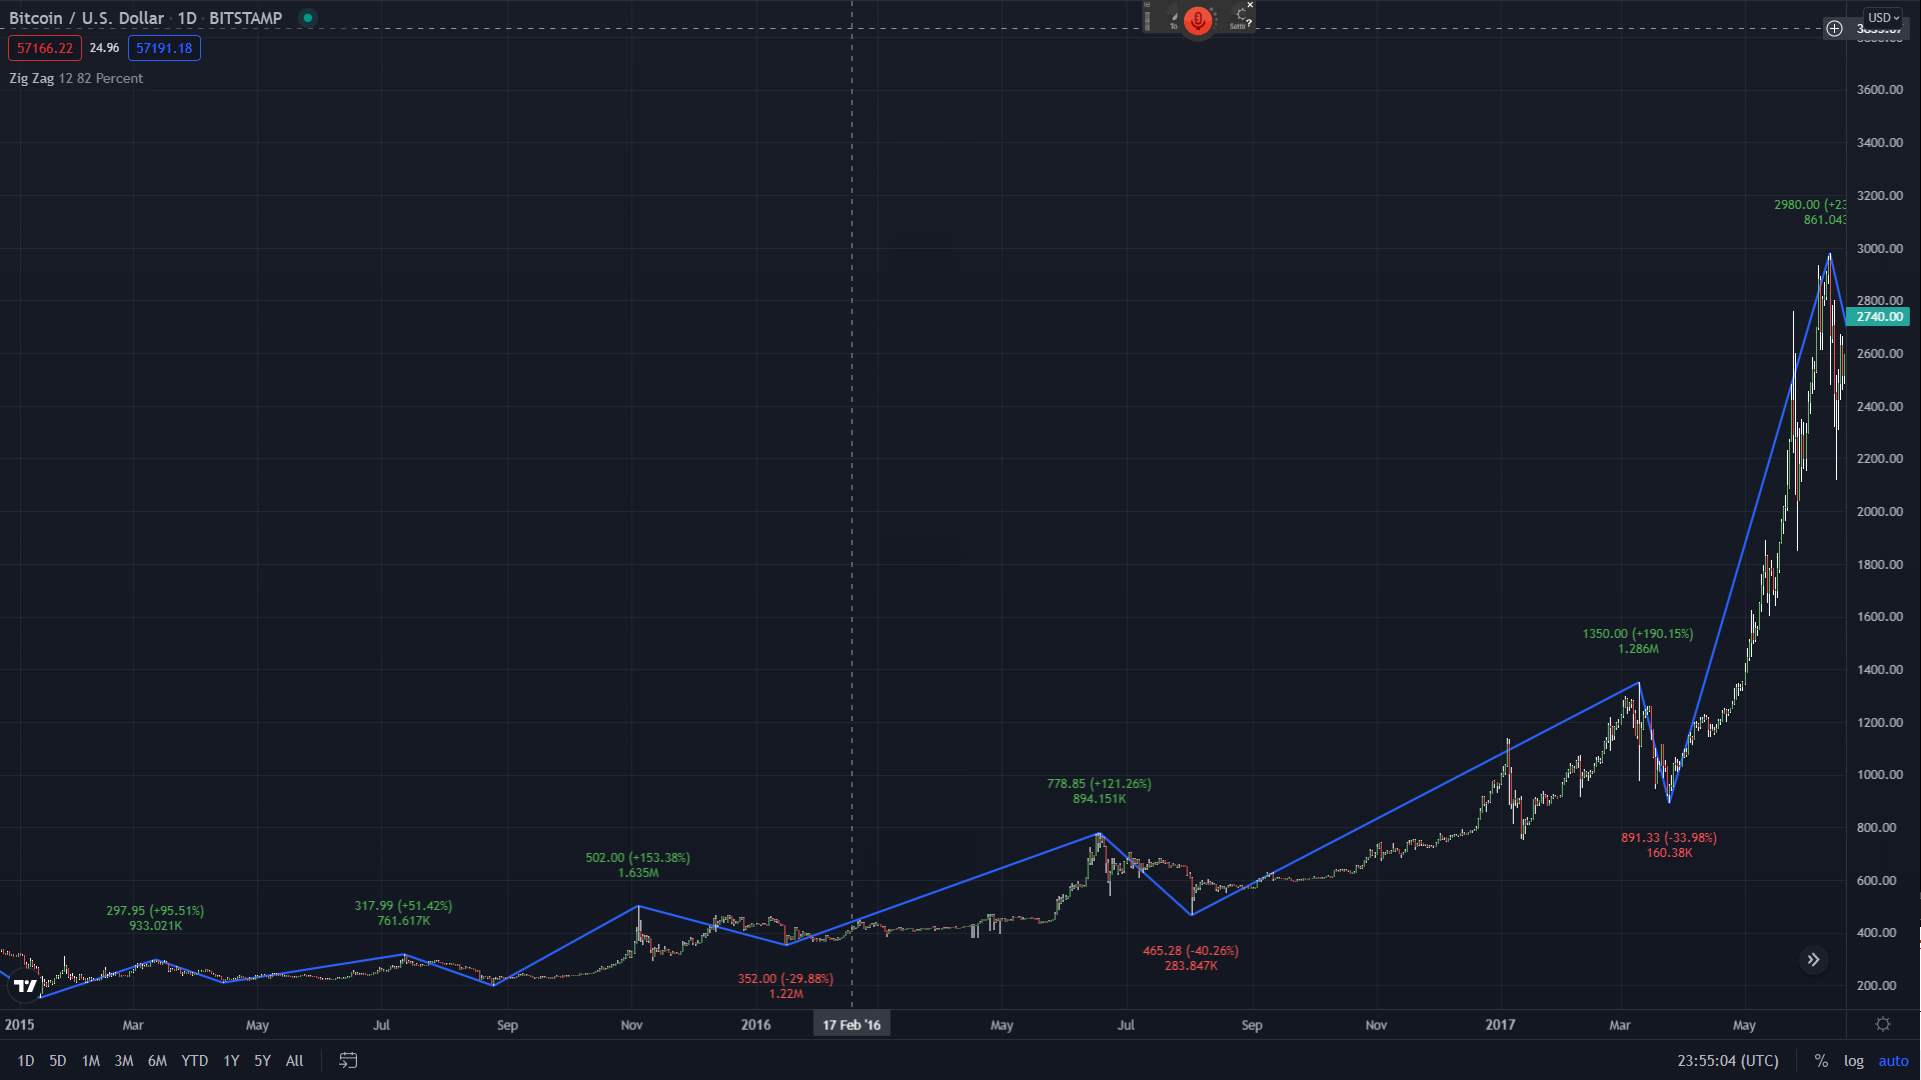
We finally have enough data to look at detailed CME Bitcoin futures on a monthly timeframe. A clear cycle has emerged, possibly not on the scale of a super cycle but the current cycle at the very least. Luckily with spot market data going back as far as 2013, we can outline more waves in the cycle and even the current super cycle.
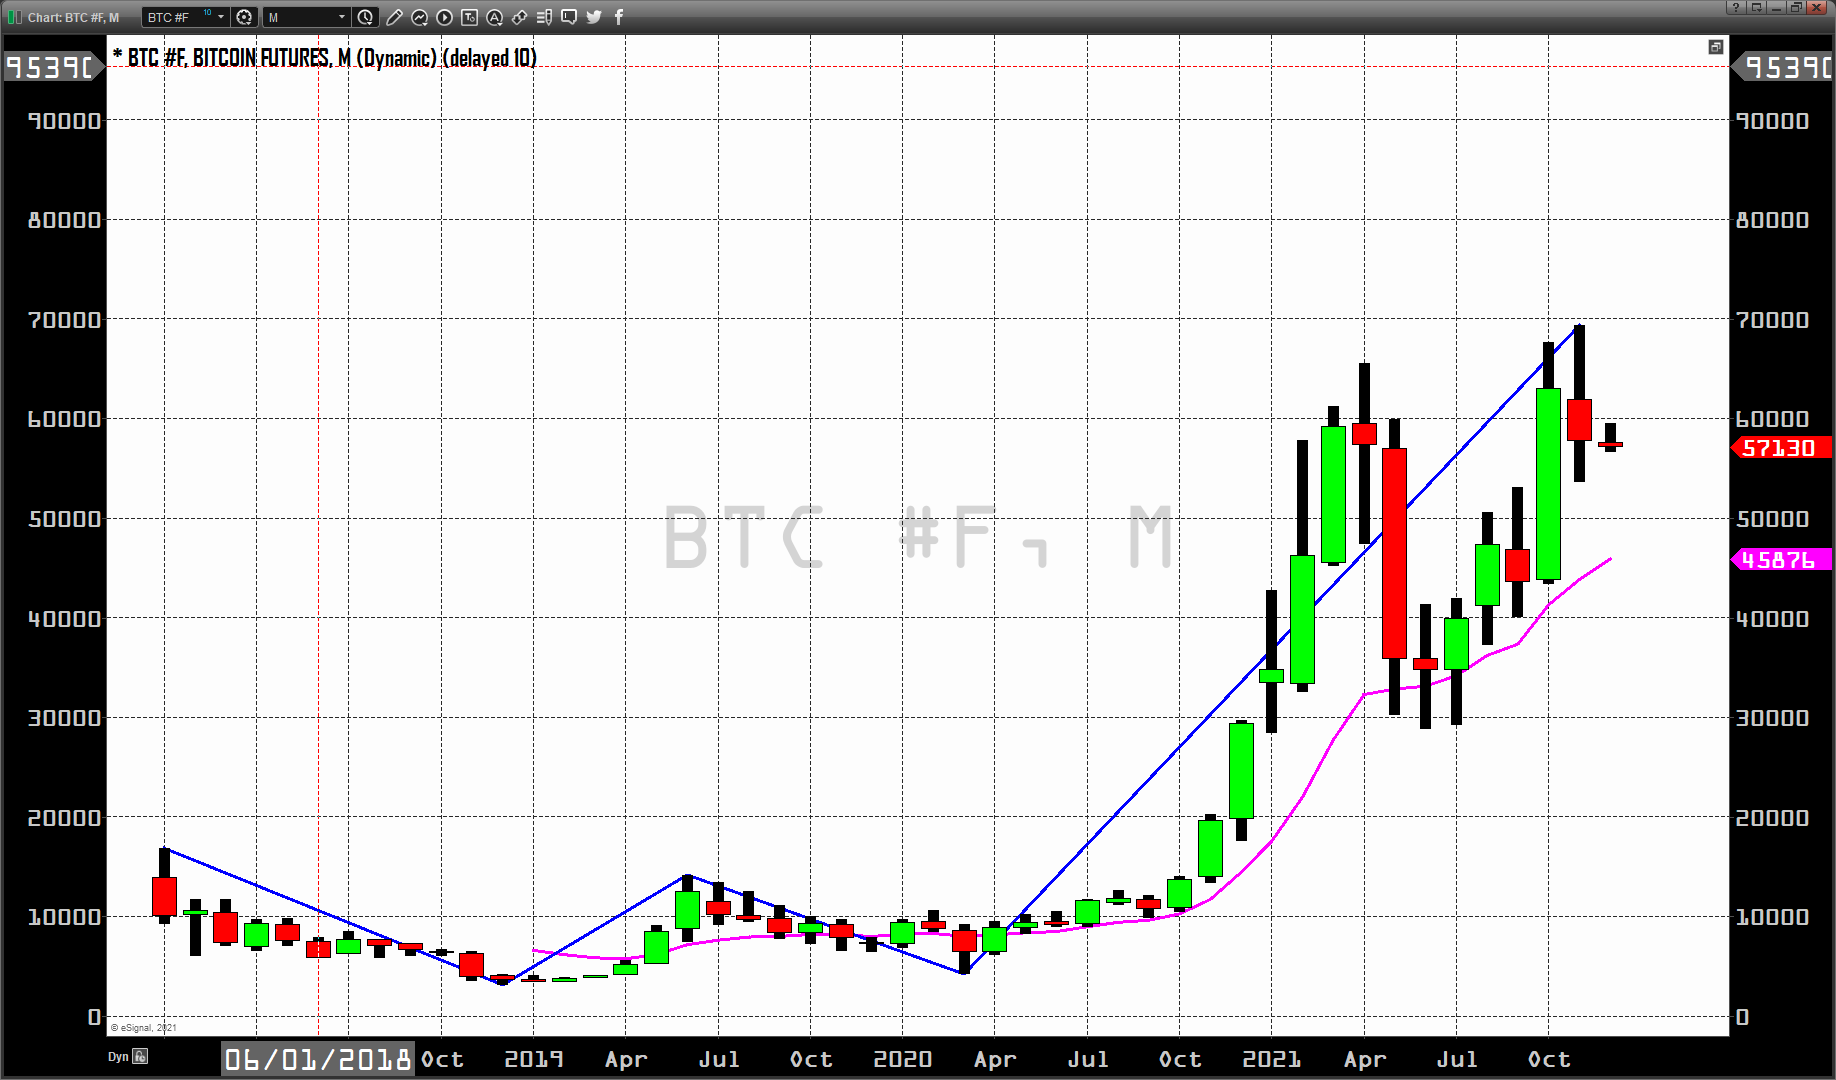
What the spot market data reveals is that we are in the third wave of a super cycle, and wave theory points to a conclusion of this third wave that prices that are in line with our recent estimates.
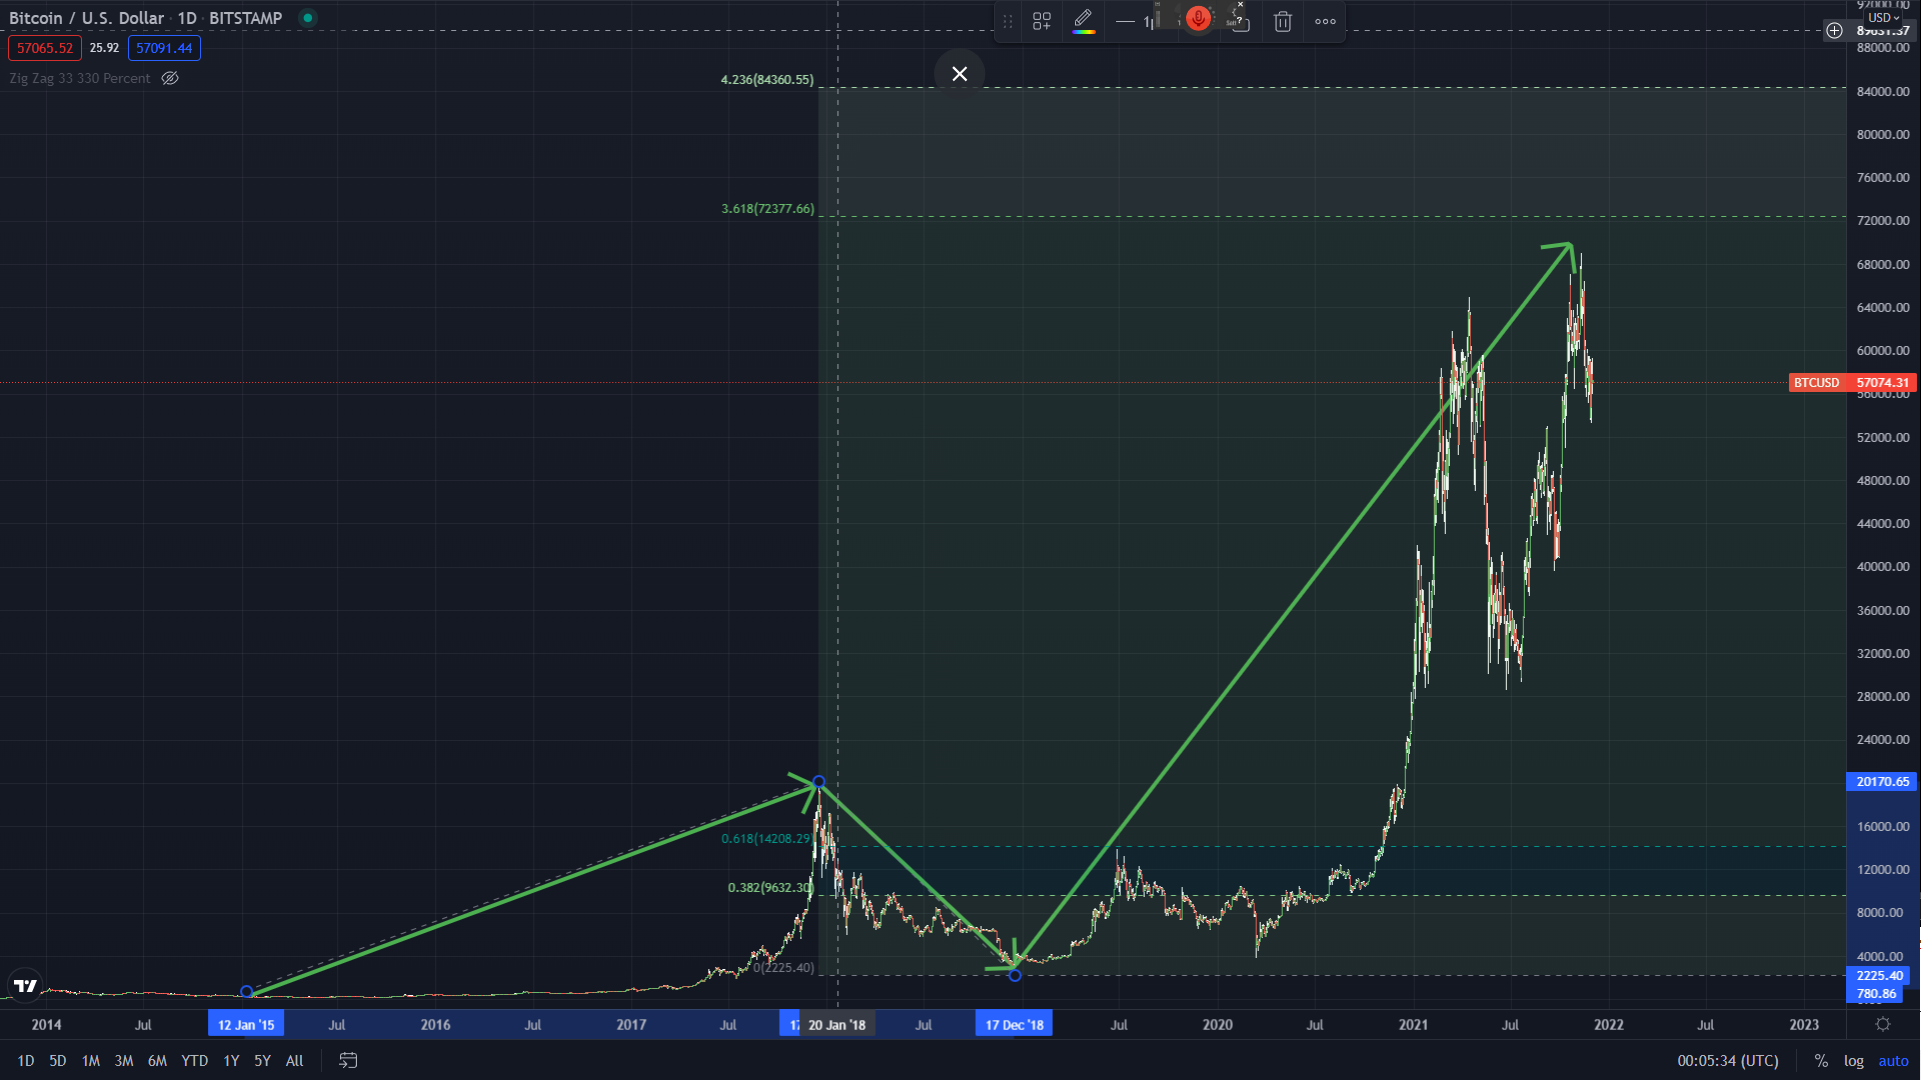
What this long-term viewpoint reveals is that the cycles illustrated on our BTC charts represent the second wave of the super cycle as well as the third wave which we believe has yet to complete. By utilizing Fibonacci extensions of the first wave starting from the beginning of the third wave, the area in between the 3.618% and 4.236% Fibonacci extensions ($72,377 - $84,360) are right in line with other technical indicators that point to the same price range that could be reached in this current rally, likely by the end of the year.
By taking the time to step back and remove all the noise from the day-to-day price action, a trader can often glimpse a much clearer picture. The fact that the picture draws the same conclusion as our erratic knee-jerk short-term depiction reinforces both the techniques used in the forecasts they alluded to.
This makes me more confident that our forecast that has not changed over the last few weeks is still the logical path ahead. In layman’s terms, Christmas will most likely gift us a new all-time high between $75,000 and $80,000.