Bitcoin Breaks Below Support, Will BTC Also Close Below Support?

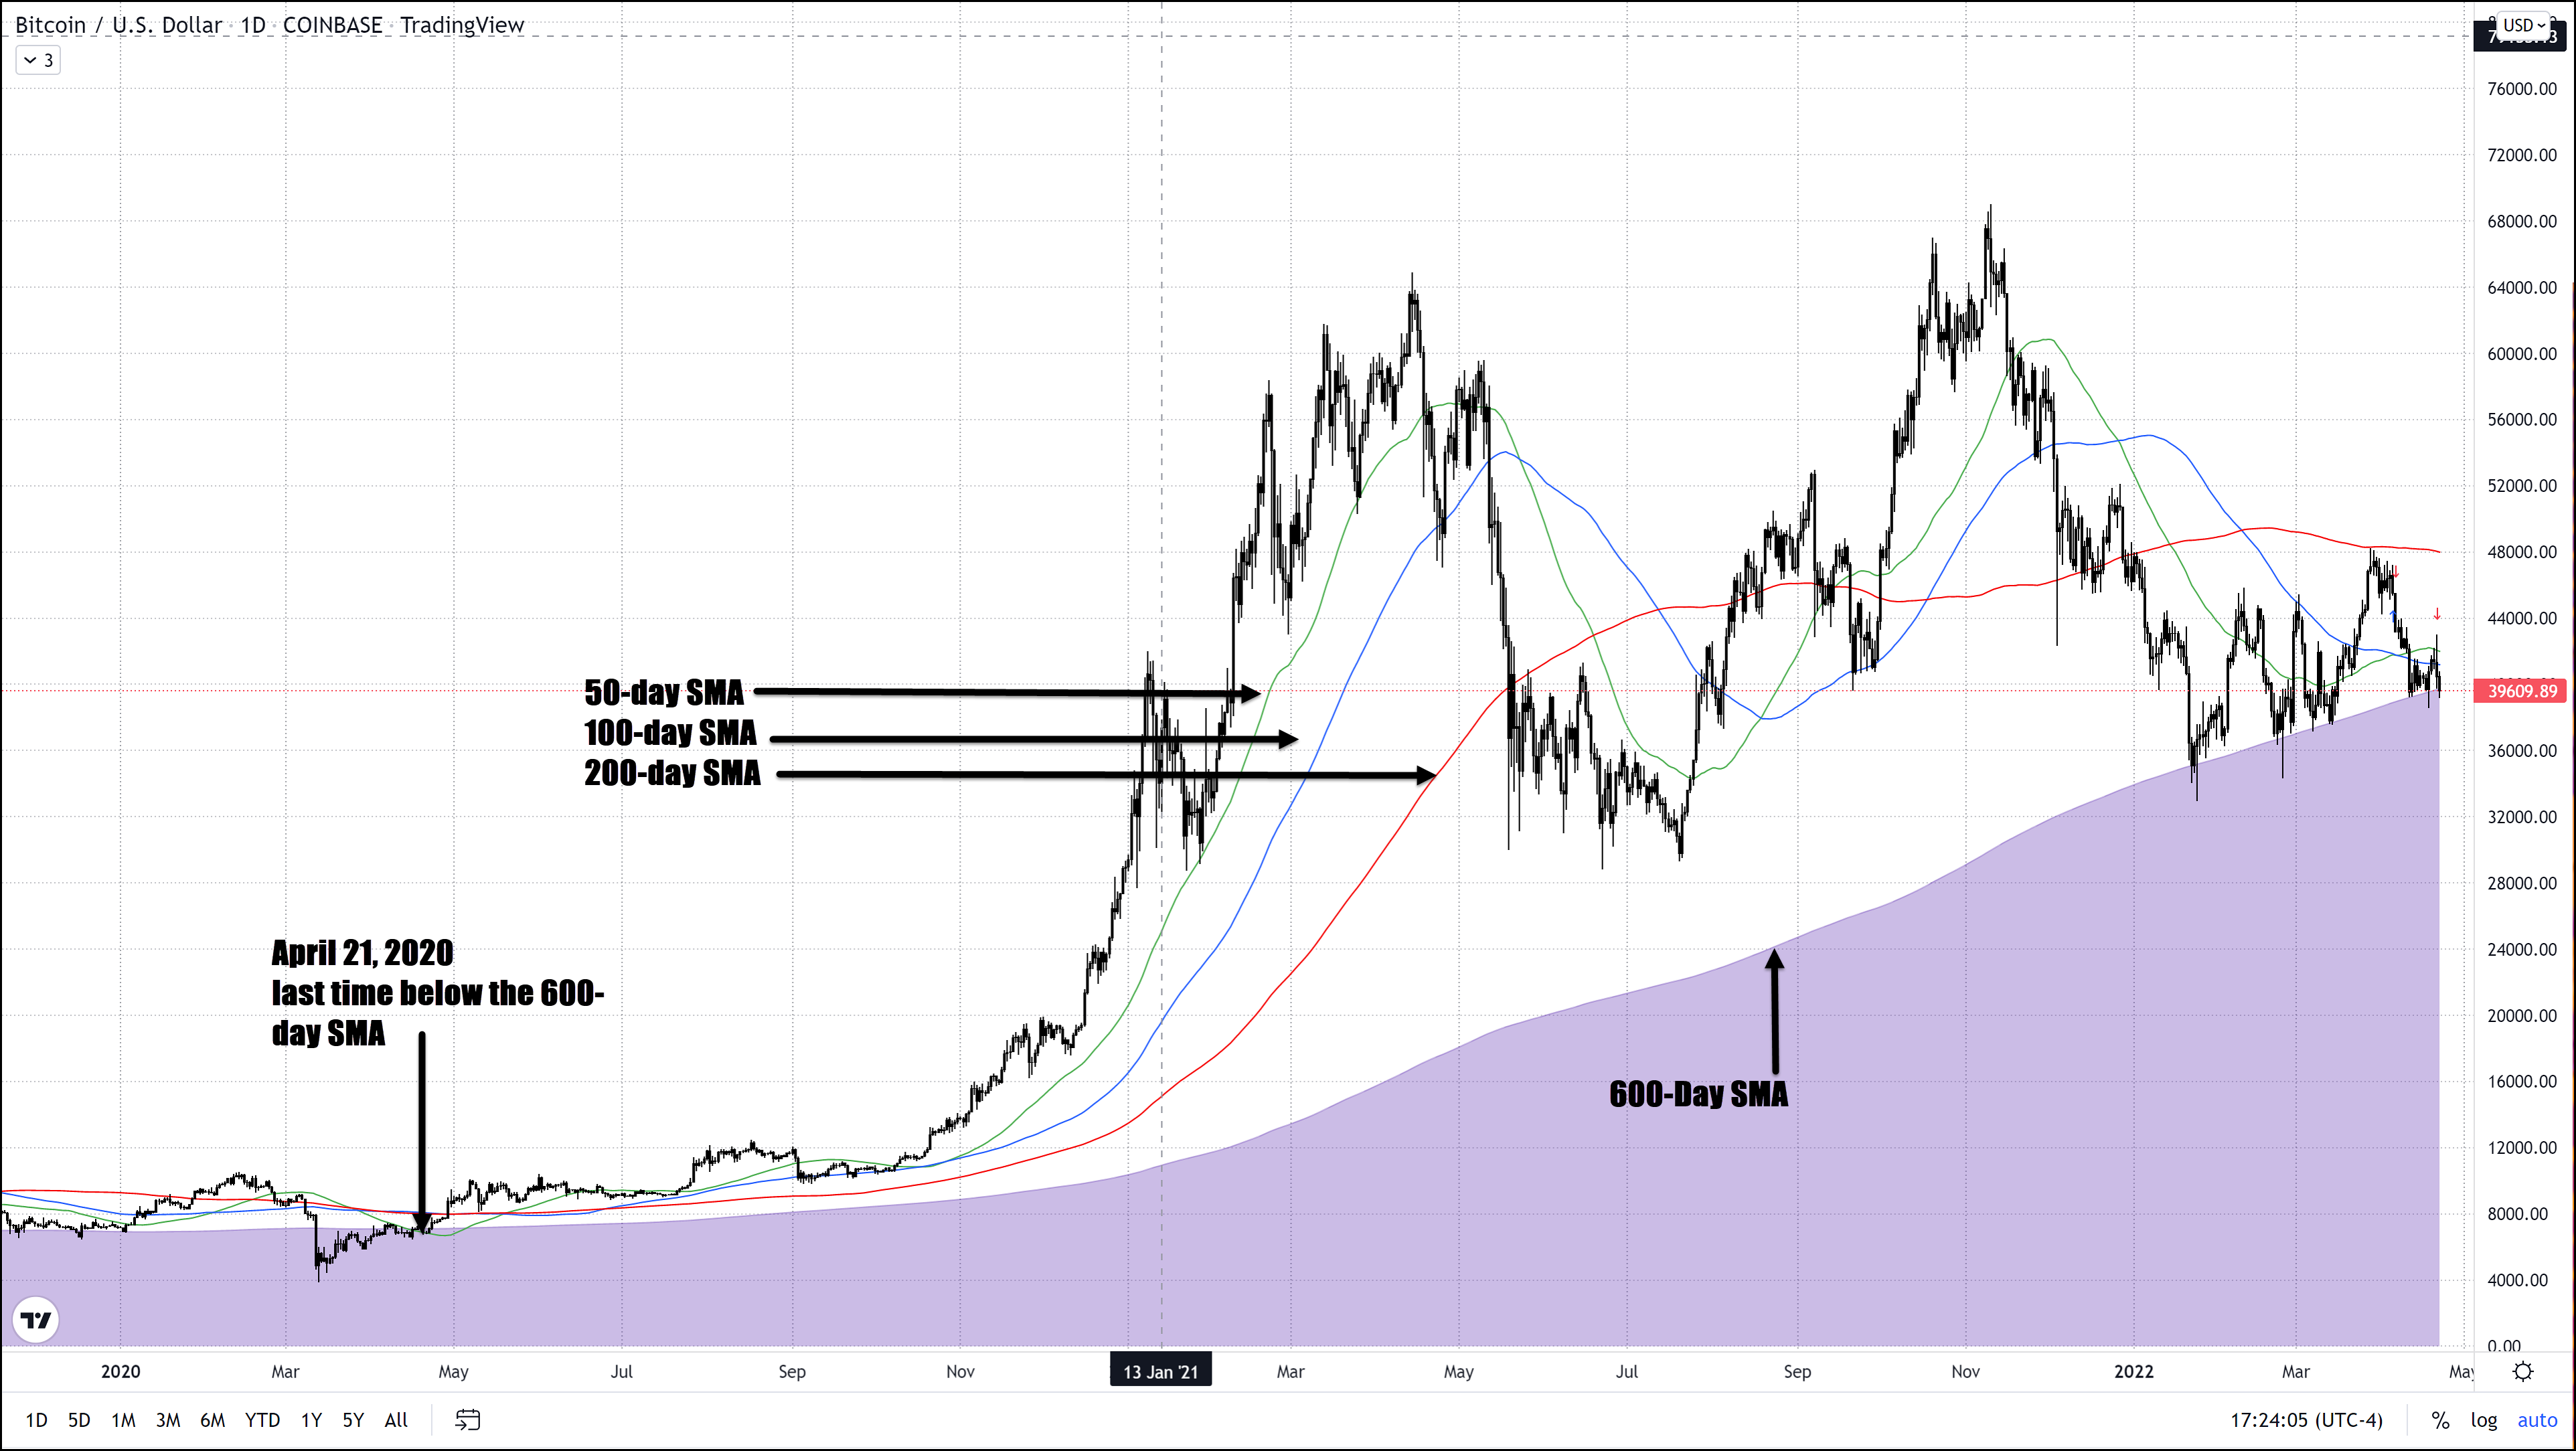
Today we got a confirmation of our ‘three-river drowning cat’ pattern with Bitcoin trading lower by over 2% or $800 as of 5:15 PM, ET. Today’s confirming candle is textbook with a lower low and lower high and appears as though we may get our first close below the 600-day SMA (simple moving average) in almost precisely two years. The last close below the 600-day SMA was on April 21, 2020 exactly two years and one day ago! Disproving many analysts that were making the claim that the four-year cycles in Bitcoin were no longer relevant. I have been disagreeing adamantly with that conclusion and believe these cycles that revolve around halving dates is very much still alive today.
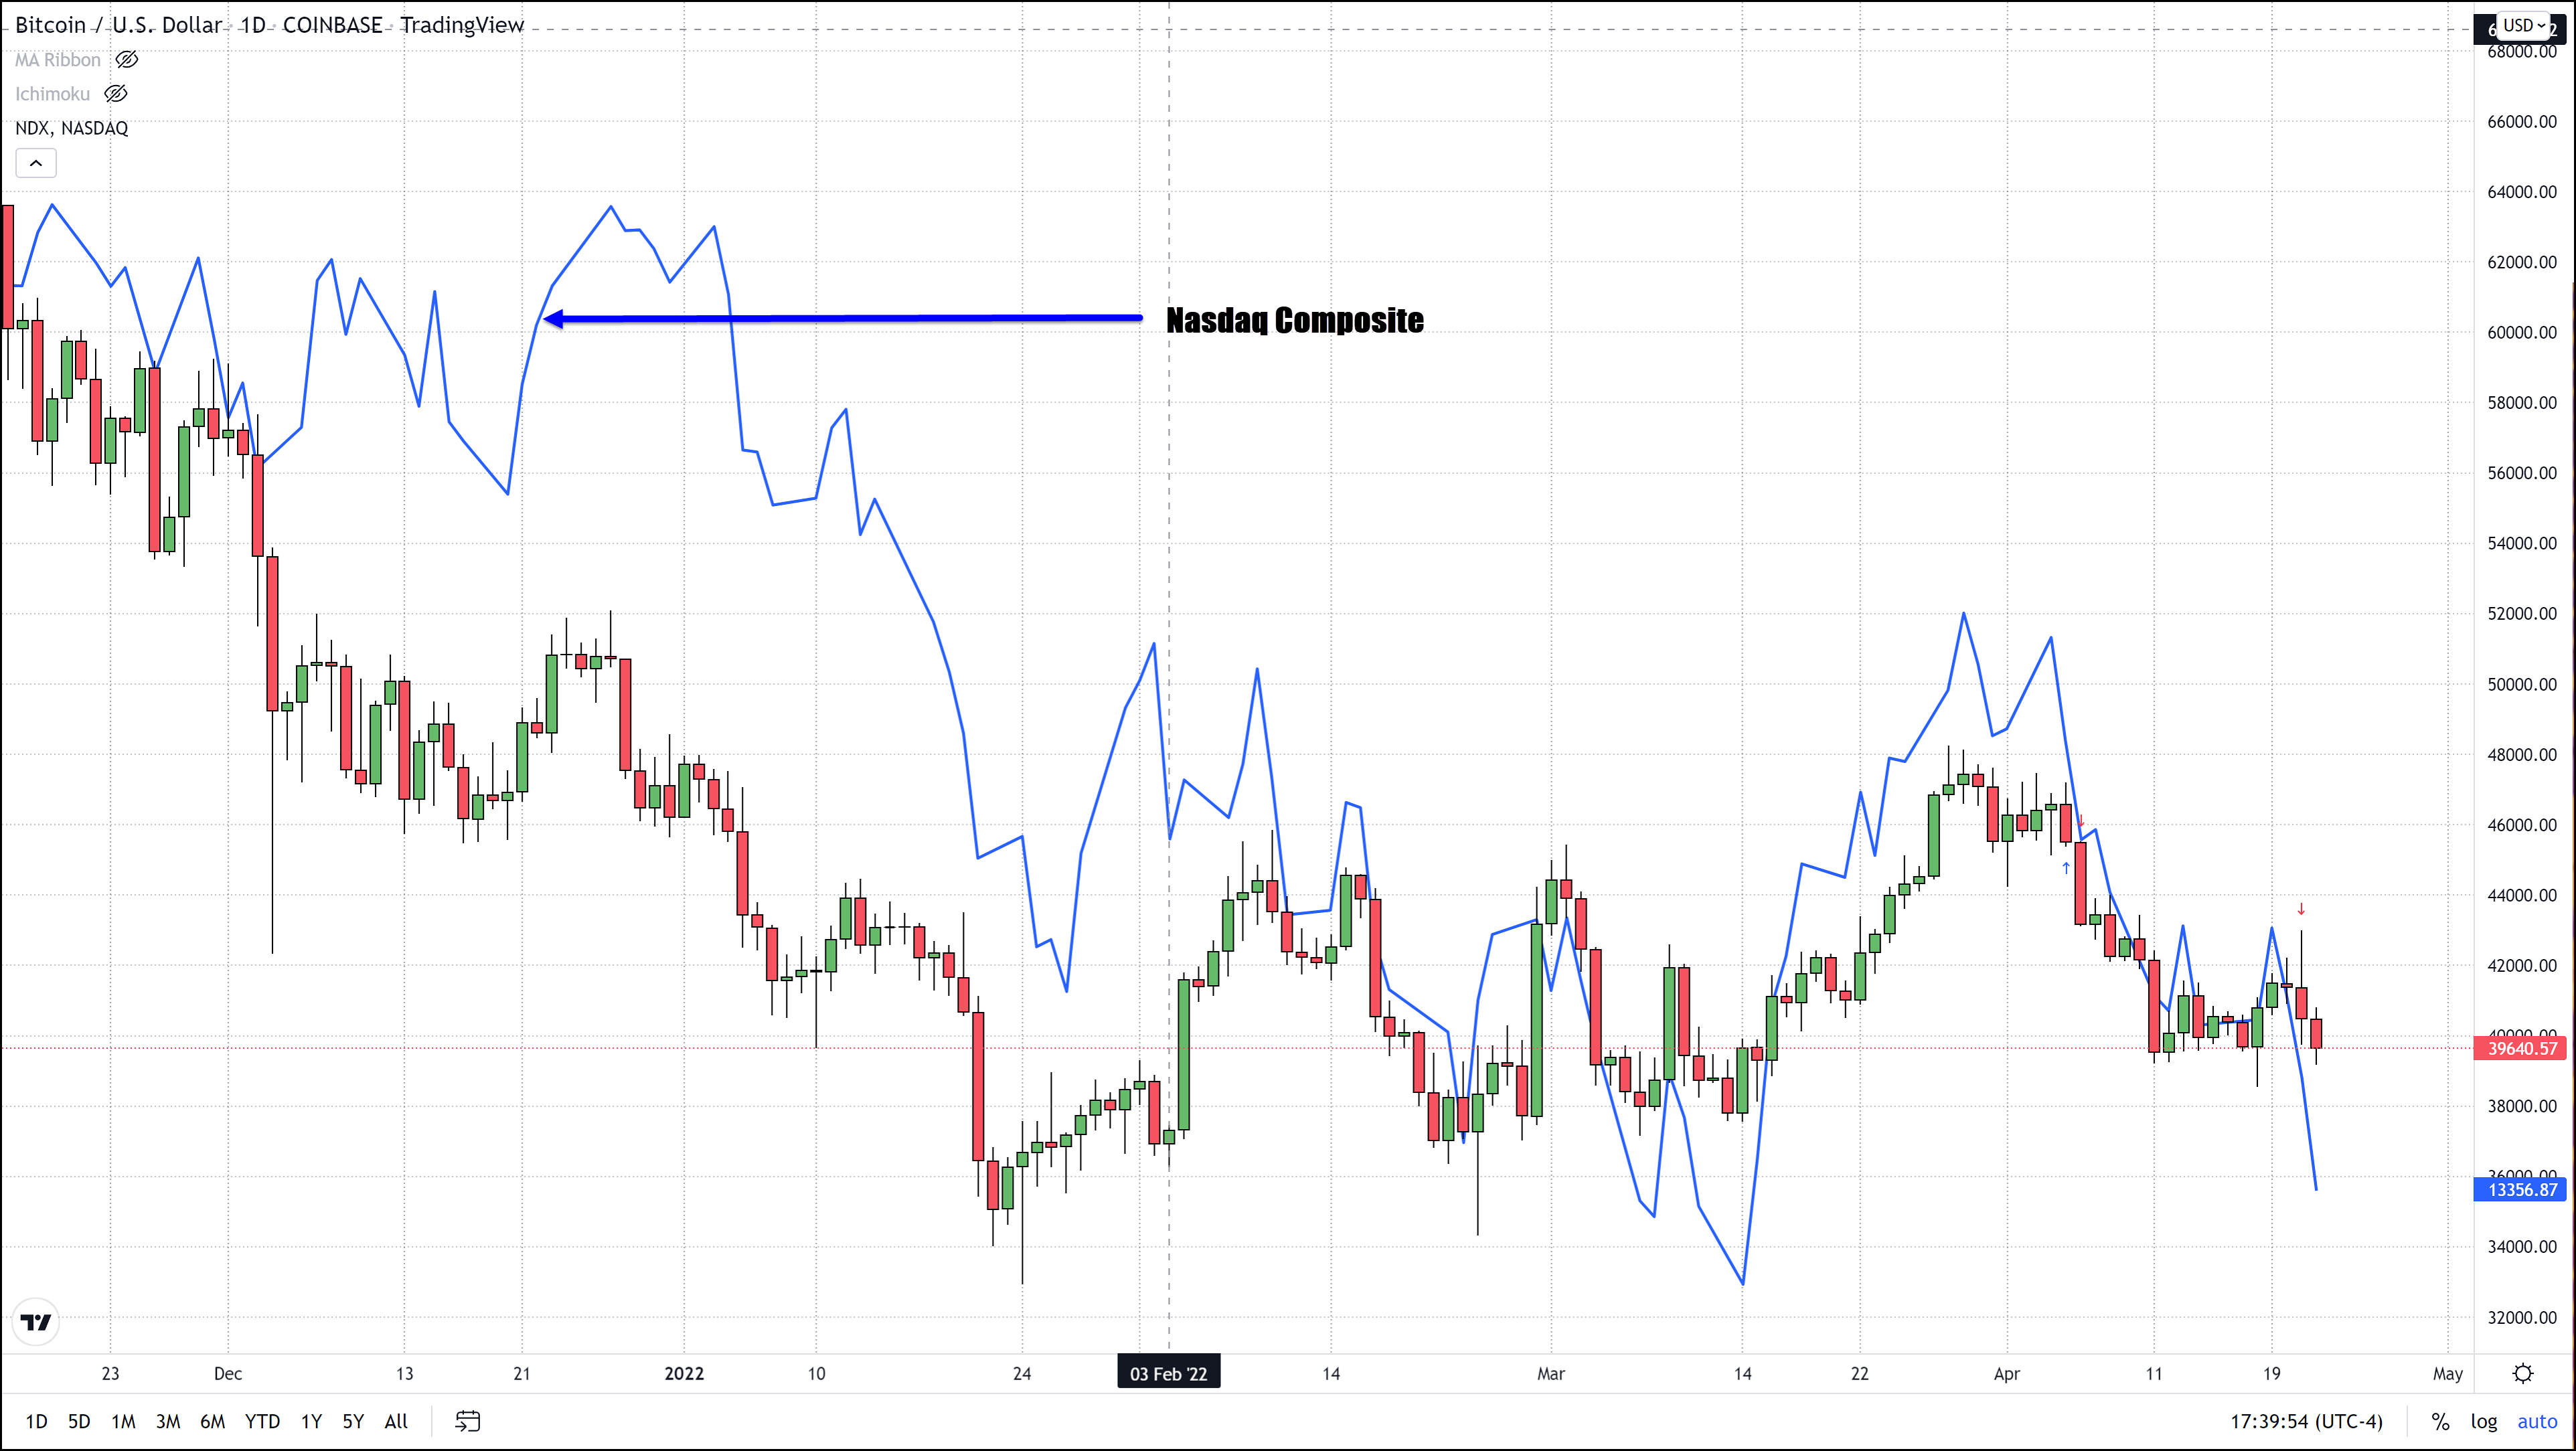
Forces that helped BTC trade lower include the decline in the Nasdaq ahead of the Fed’s raising of interest rates. The correlation between the Nasdaq and BTC are at 0.7, a 1.0 correlation would mean that they mirrored each other’s movement exactly, and a 0 meaning the moved opposite to one another.
With today’s confirming candle we can now lower our protective stops to just above our entry price of $40,800 as the high of the day was literally right below or above that price point depending on which exchange you trade on. All traders who took our initial call to go short and sell Bitcoin at the above-mentioned price should now lower their protective stops to right above our entry price to lock in a no loss trade at worse.
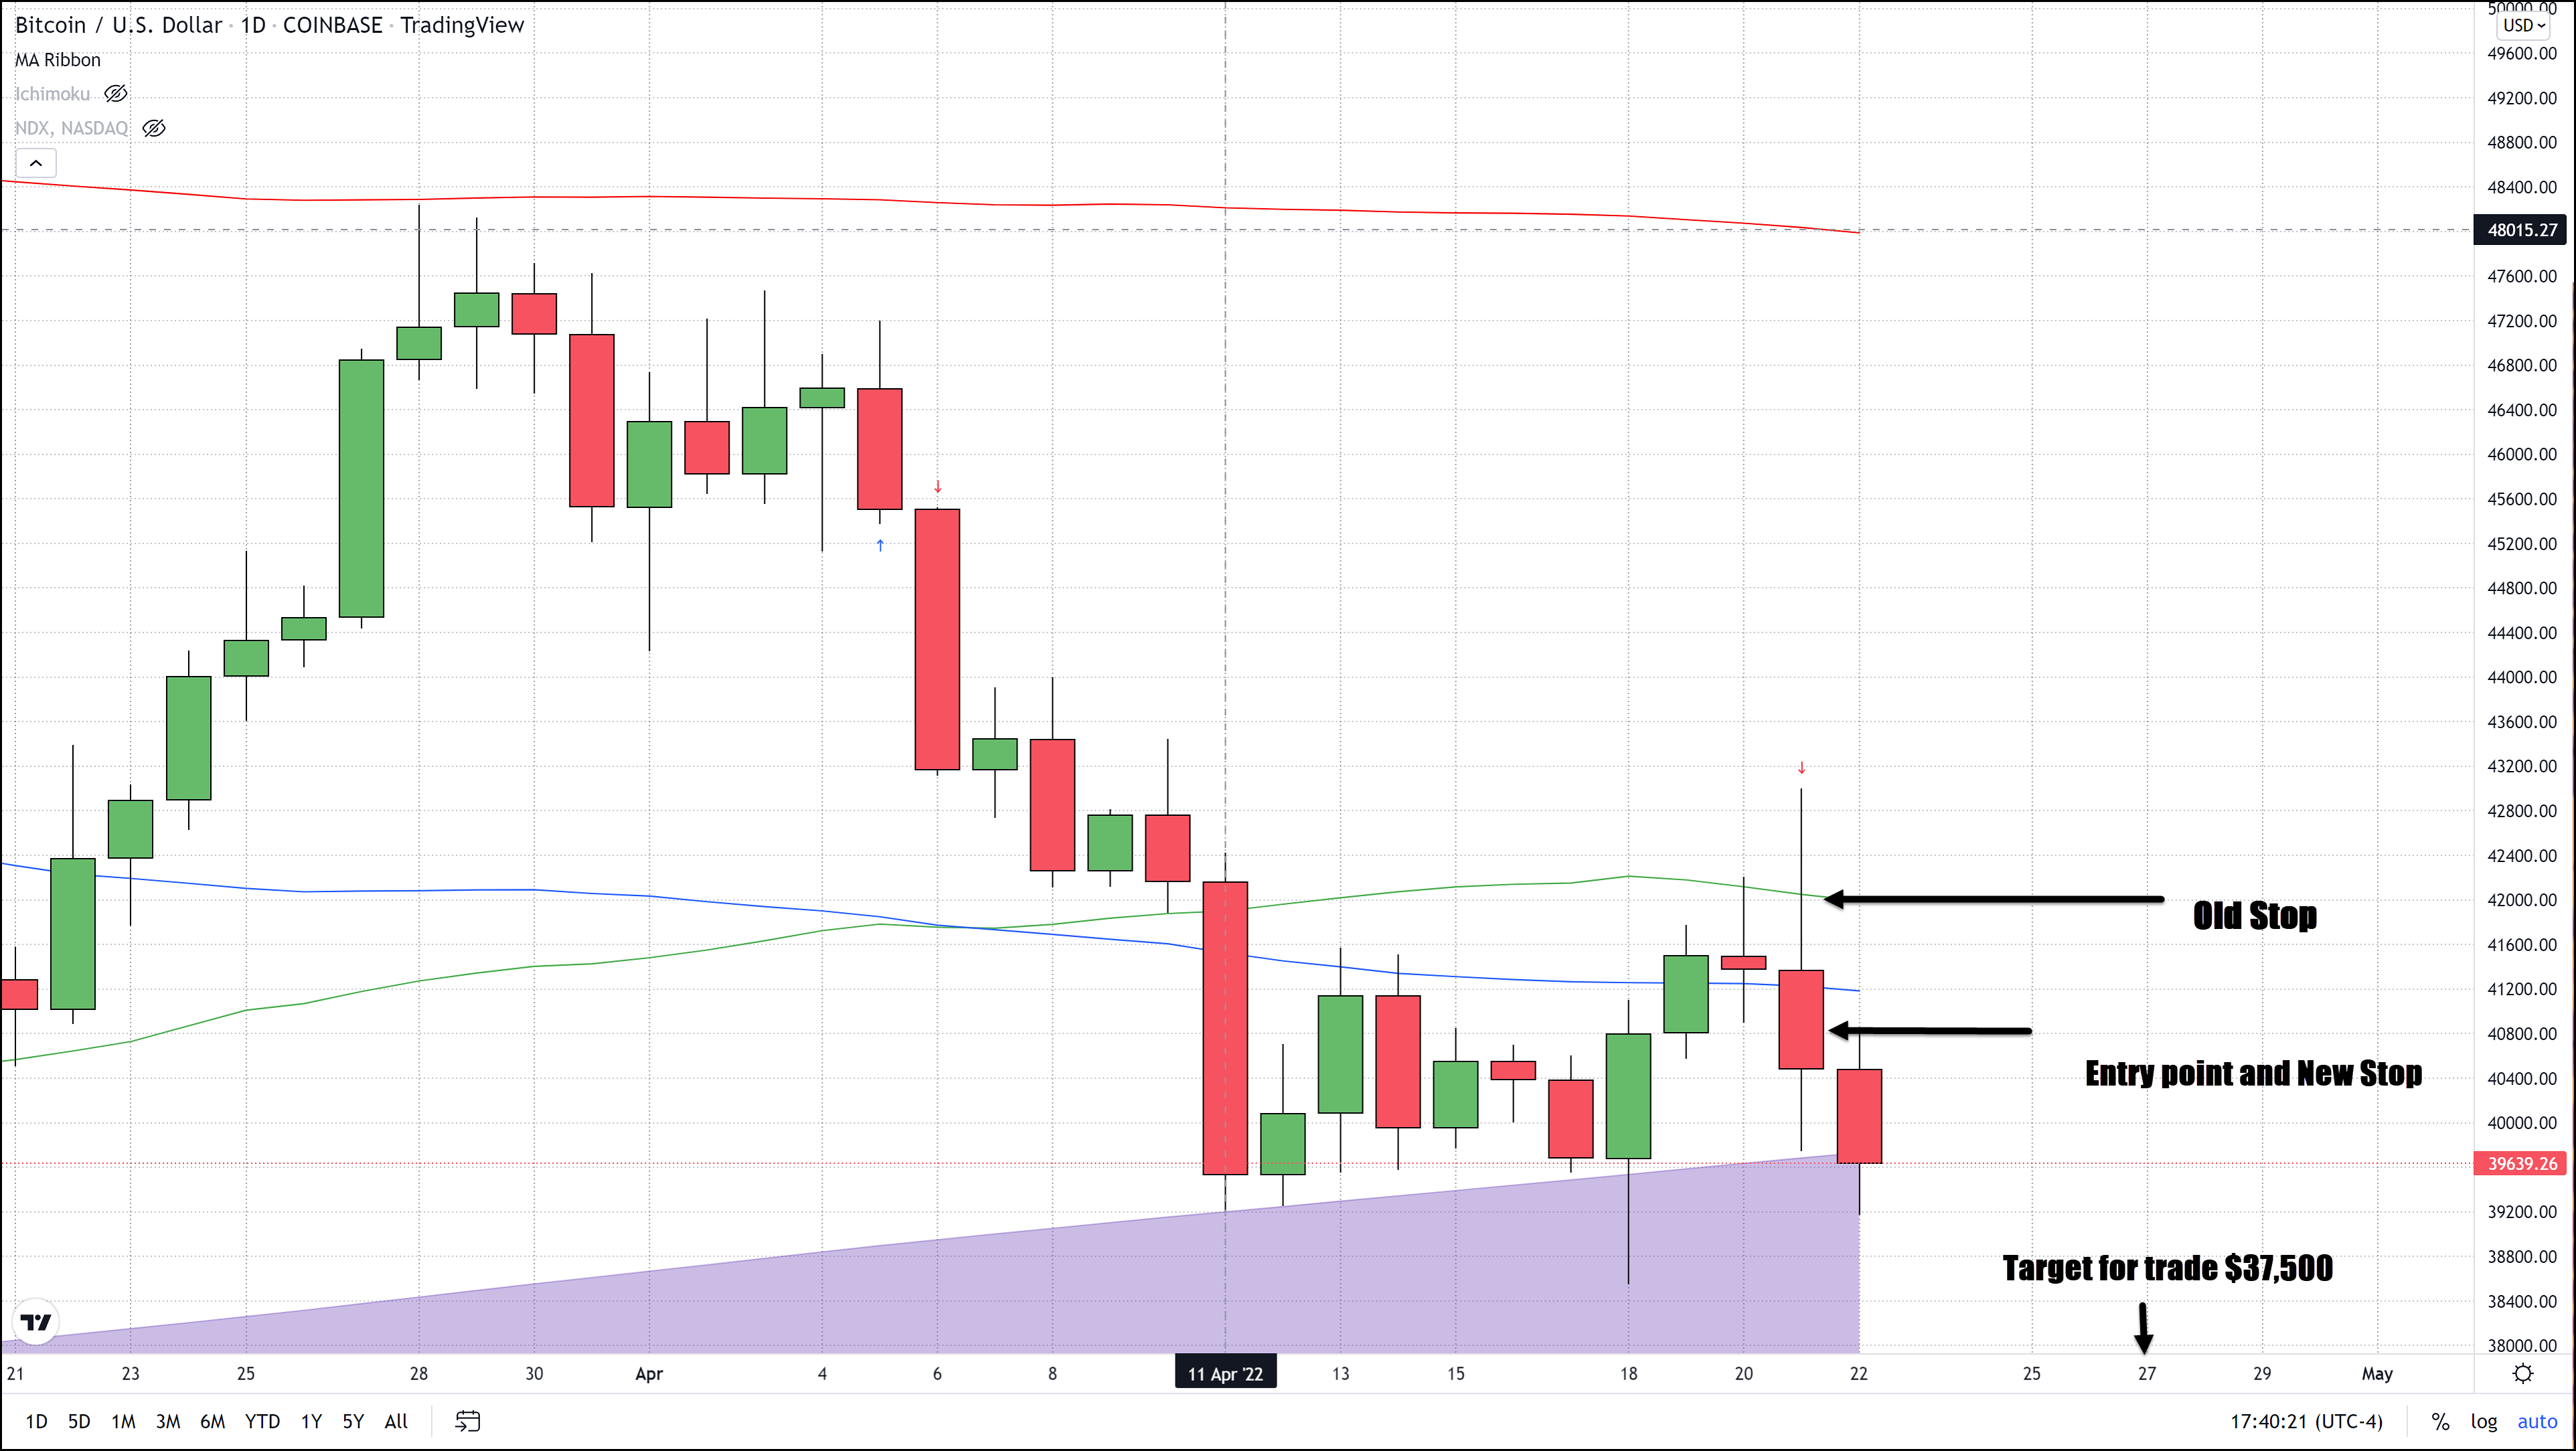
Take protective stops from $42,000 down to $40,850. Our target for this trade is $37,500 and traders can either watch the market closely or simply add a limit to your trade at $37,500 so you effectively will automatically pull profits if that price point is reached.