Bitcoin’s Fibonacci harmonic

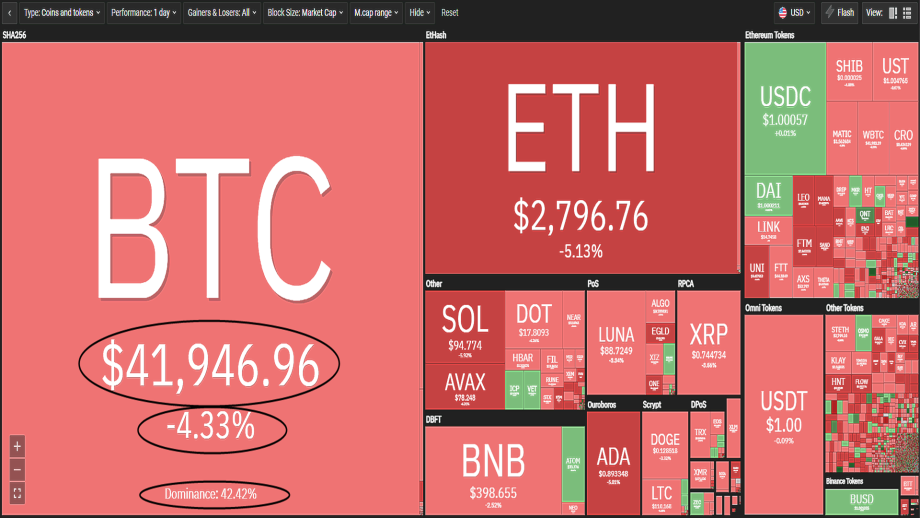
Today Bitcoin is trading down by roughly 4.2% and trading hands around $42,000. The current market dominance is 42.42%. Numerologists have fun with that one.
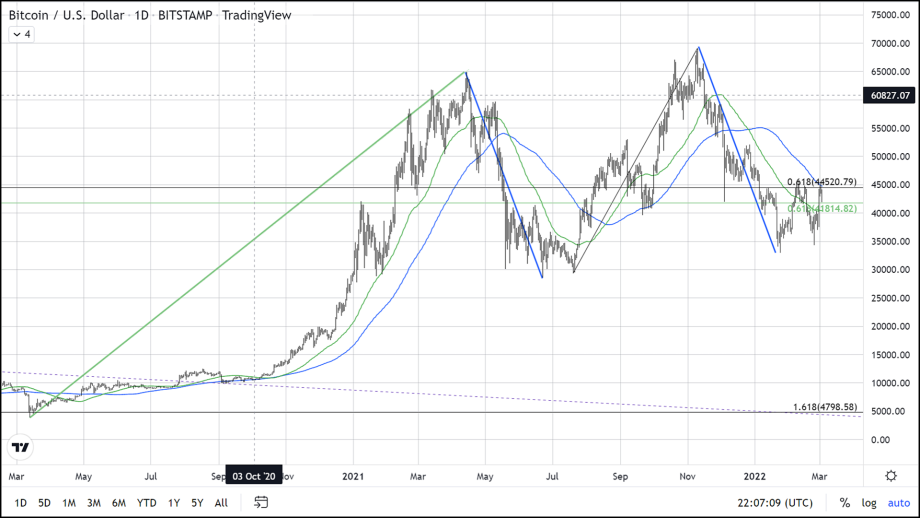
Bitcoin is trading between two technical levels, as well as a key retracement number from both of the rises above $60,000.
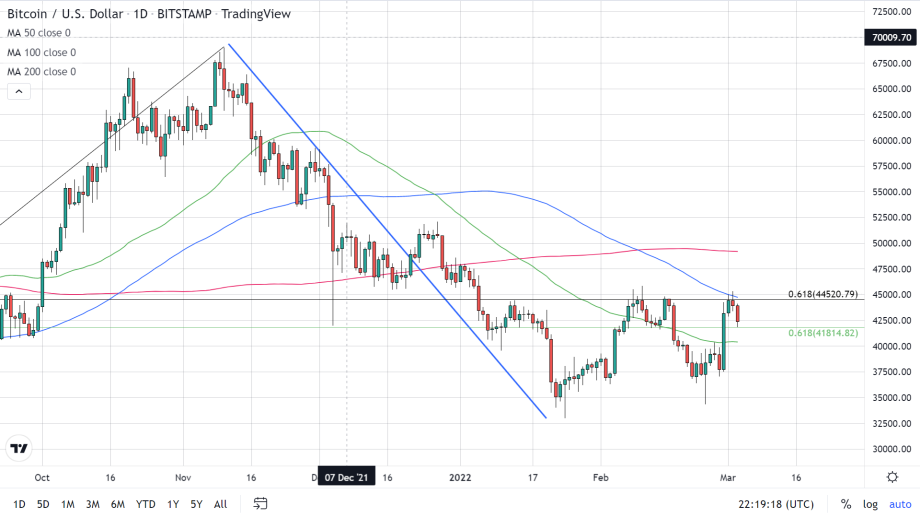
Technical traders may recognize today’s low and tentative support at $41,800. You have to look back to January 2021, when this price level was relevant. Recently it has re-emerged as an important short-term level that Bitcoin failed to hold three times. Each attempt to break above the current 61.8% Fibonacci retracement (~$44,500) was unsuccessful.
As of 5 PM EST, Bitcoin shows signs that a bounce may have occurred at the old 61.8% retracement which sits at $41,800. If Bitcoin can hold this level that it failed to hold after rejection at the current 61.8% retracement it would be very bullish. Conversely if this level fails a further decline to $37,000 is likely.
BTC is sandwiched between the 100 and 50-day moving averages. The 100-day is resistance and the 50-day is current support. This means that the moving averages are in full bearish alignment. The three major moving averages used are the 50,100 and 200-day.
The most important area the bulls must hold is $41,800. If Bitcoin breaks below that level the bearish faction will gain control.


