Bitcoin’s recent breakout confirmed today

Bitcoin is trading higher on the day and is set to form the first green candle since hitting resistance at the 200-day moving average. A green candle indicates that the closing price at the end of the day was higher than the opening price at the start of the day or session. As of 4:30 PM EDT, the world’s largest cryptocurrency by market cap is selling for about $46,300. Although today’s candle will likely continue a streak of lower highs and lower lows over the last three days, it is the low that I want to focus on as it reaffirms that bullish sentiment is still dominating the market.
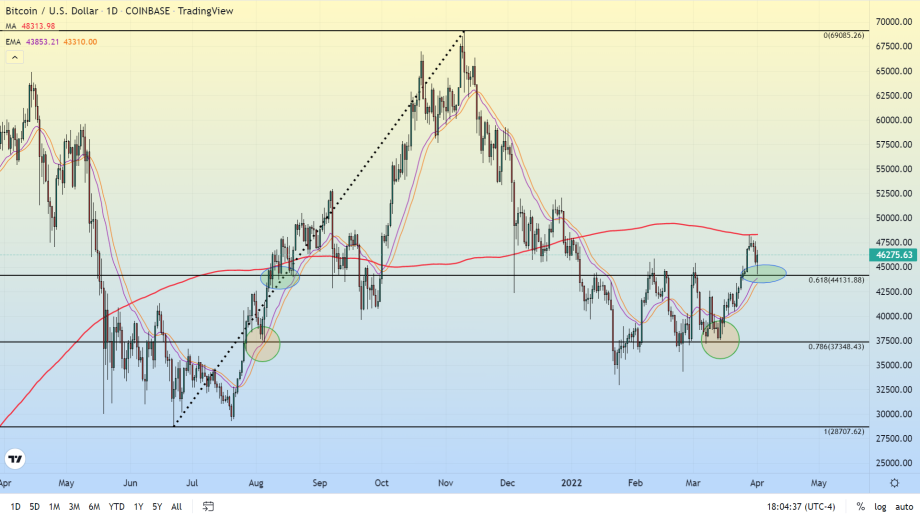
Our longer-term Fibonacci retracement spanning from the lows last of last June to the all-time high of last November, $28,700 - $69,000 has been very accurate in providing us with key price points to watch for pivots and break out zones. The 78% retracement level comes in at $37,350 and served as support three times in two weeks from Feb 28th to March 13th. In a previous article published on 2/22/2022 titled “Bitcoin’s Three Unbreakable Truths” we pointed out how almost every major rally in Bitcoin (2011, 2013, 2017) was followed by a retracement equal to or greater than 78%. With the exception being the 2021 bull run, that only came back down to the 61.8% level afterward. The 78% retracement level at $37,350 has strong historical significance. If we look back to the end of July to the first part of August 2021, that same price served as a jumping-off point (Aug. 3rd through Aug. 6th) to much higher prices and an end to the previous accumulation period. Bitcoin then went on to move above what is now the 61.8% retracement, $44,131 (when charted via Coinbase) four days later.
So, what is so bullish about Today’s low? The intraday low hit today came in right above the 61.8% retracement. This price point had been resistance for three months up until last weekend when finally had a closing price above this critical level. It was that breakout that caused us to conclude that Bitcoin had exited its accumulation period and entered into a fresh rally mode. The effective defense by the bulls at this level reaffirms that assumption. Looking at the past year of trading, the precise similarity between the two accumulation periods the symmetry is startling. If this continues into the next few months, we will certainly make a new ATH like we predicted last week and reach as high as $85,000 in 2022.
