Technical, Historical, and Fundamental data point to lower prices for BTC

All signs point to a further decline in the leading cryptocurrency after making a new record high last week. We discussed previously how BTC has never made seven consecutive monthly gains and with little over a week left in March the price only must come down a few thousand dollars for this pattern to remain unbroken. This week Bitcoin gave up 11.5% and there are many indications that the price will continue to fall including technical, historical, and fundamental influences.
You would be hard-pressed to find any short-term technical indicators that paint Bitcoin as an asset that is not top-heavy and ready for a healthy pullback. Today Bitcoin opened below the 20-day exponential moving average and has since fallen lower, indicating a clear break below this moving average. The last timed that Bitcoin opened below the 20-day EMA and was unable to break back above it was 56 days ago.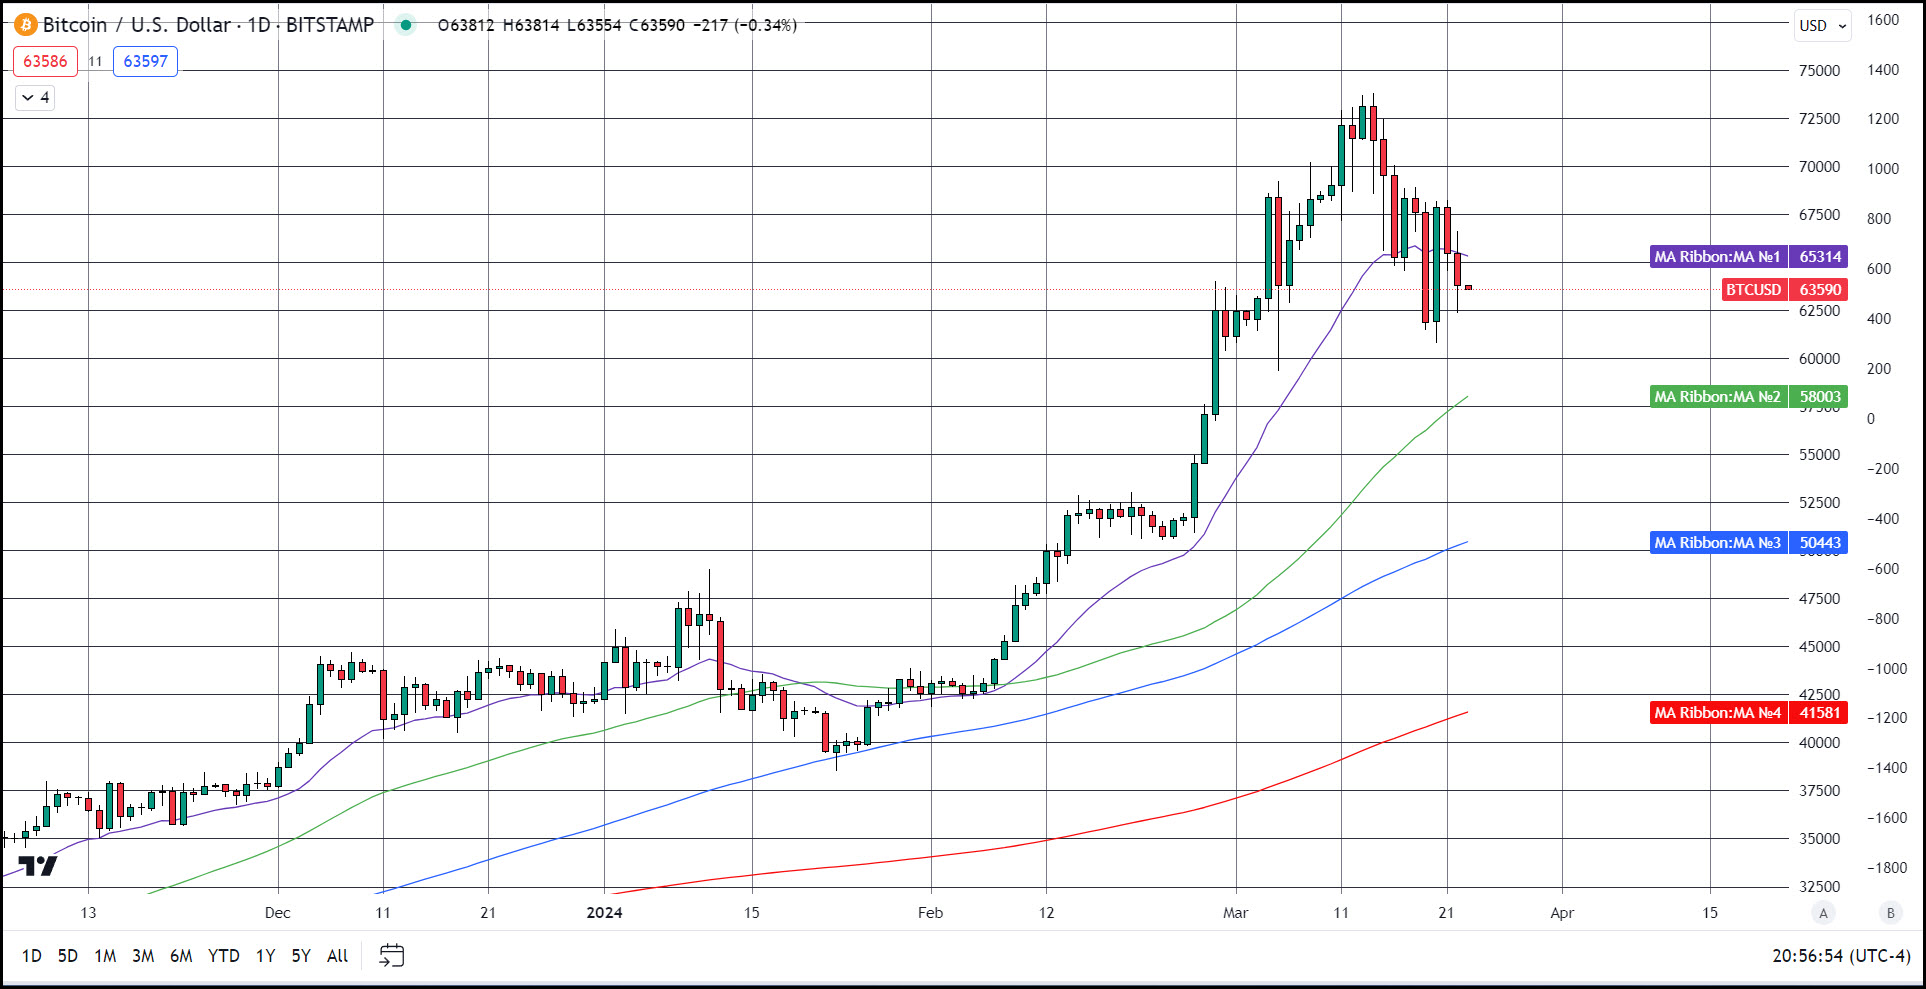
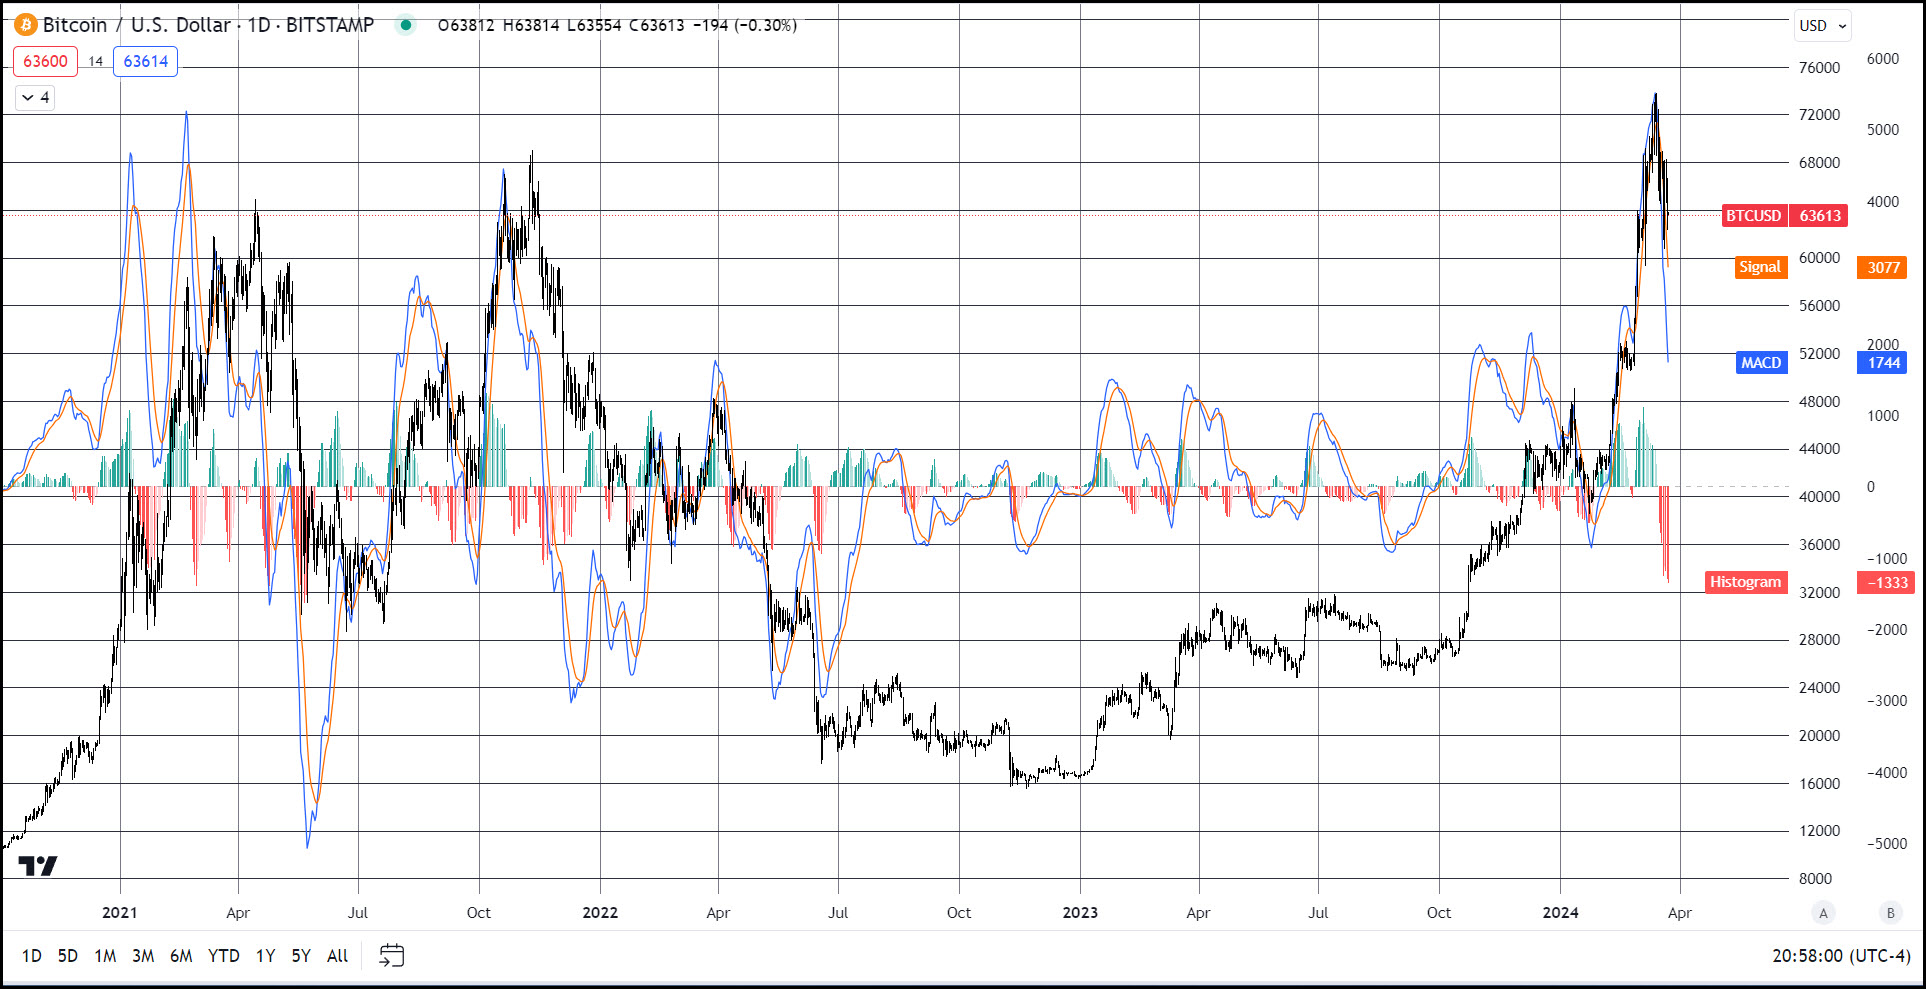
The MACD also had a signaled a bearish signal line crossover (bearish signal line crossovers occur when the MACD line crosses below the signal line) the day following a new record high and since then has continued to drift to lower values. The last instance of a value this low (-1368) was after the 2021 record high in May 2021. In May 2021 BTC gave up 35% forming the largest monthly decline in history. This large monthly decline came after reaching a new record price and only one month after six consecutive monthly increases. This is a shockingly similar scenario to what we find today, and that is not the only historical pattern that foreshadows a continued price decline.
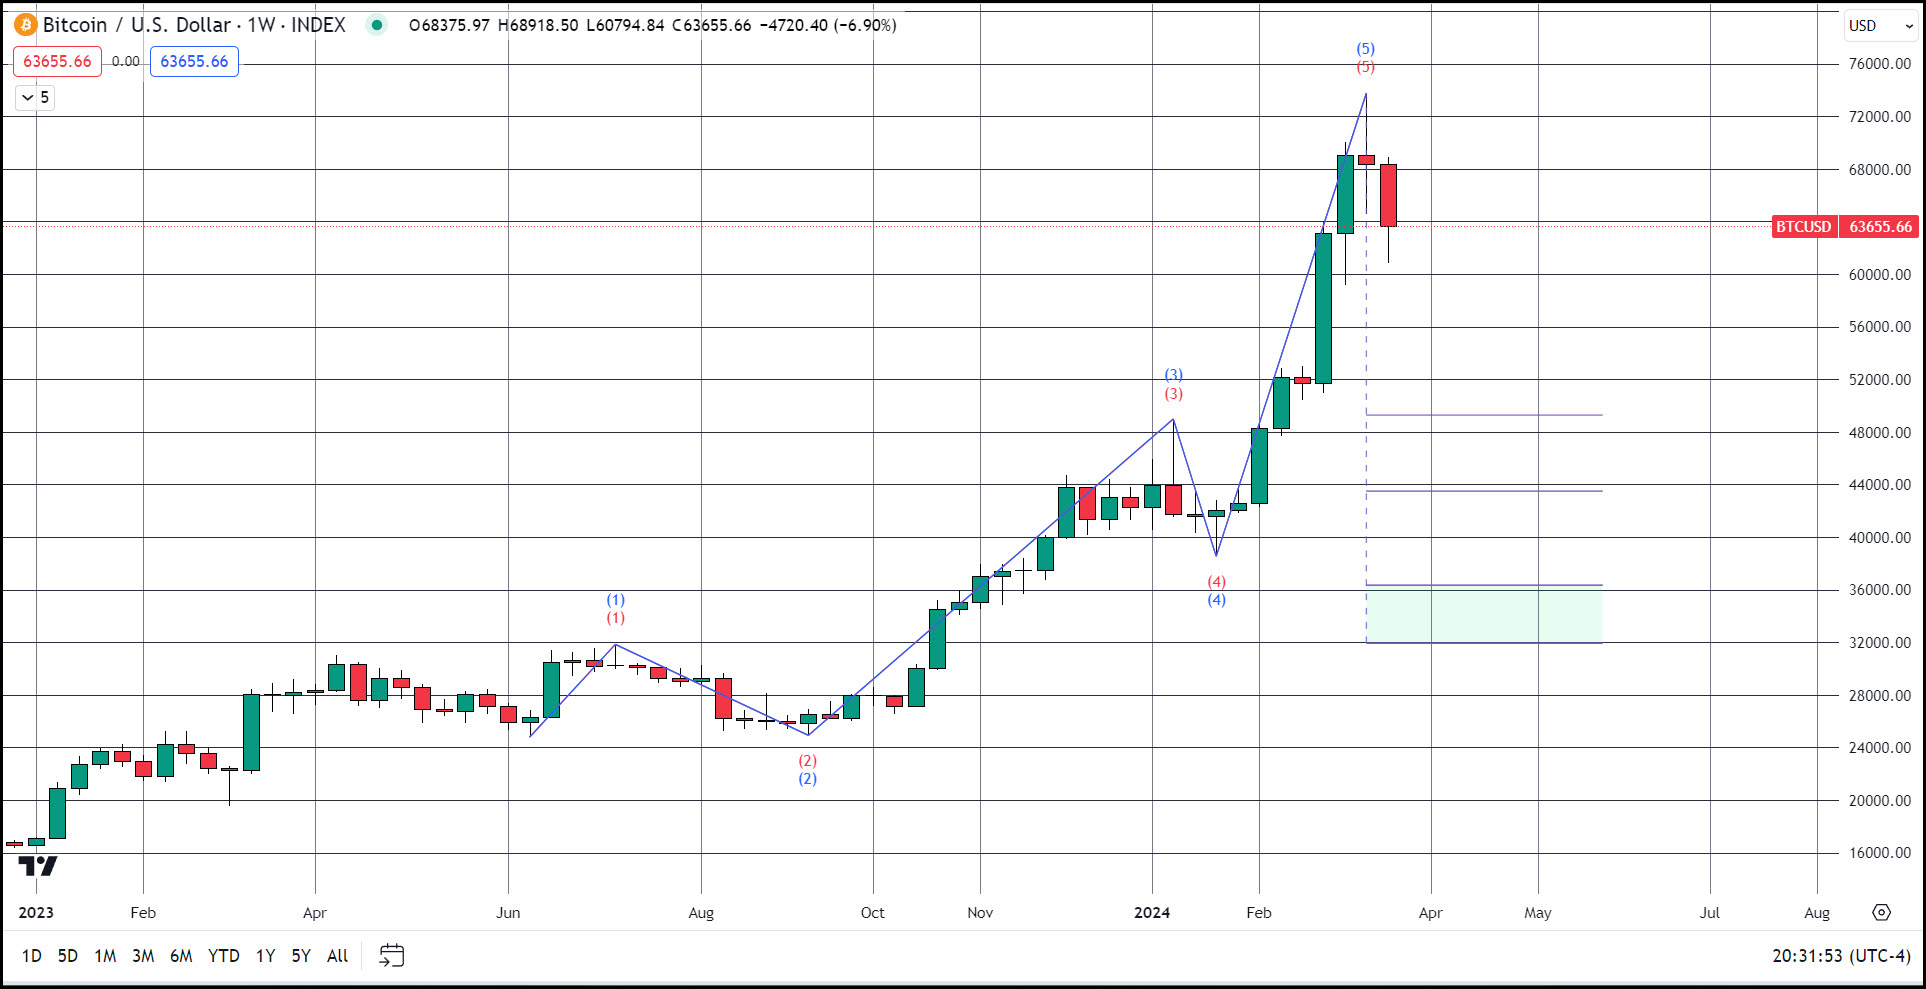
These indicators align with my current wave count (aka Elliot Wave) for Bitcoin that labels the run-up to the new record high as a wave five in multiple levels (fractals) and on multiple timeframes. Wave five marks the last motive wave in an impulse cycle and is usually followed by a corrective phase. The count from the weekly chart creates a clearer defined count than on daily timeframes and using an Elliot Wave based wave counter and strategy (Luxalgo) makes a prediction that Bitcoin will fall to between $49,000 — $32,000.
Prior to the three halving events that have already occurred, all exhibited some sort of pullback in the surrounding weeks. Bitcoin tends to rise in the months before each halving and has one last dip in the last moments before the actual event, which tends to be short-lived as the month of the halving has always contained a small trading range that then accelerates into very large gains.
Bitcoin’s lucky number sure ain’t seven
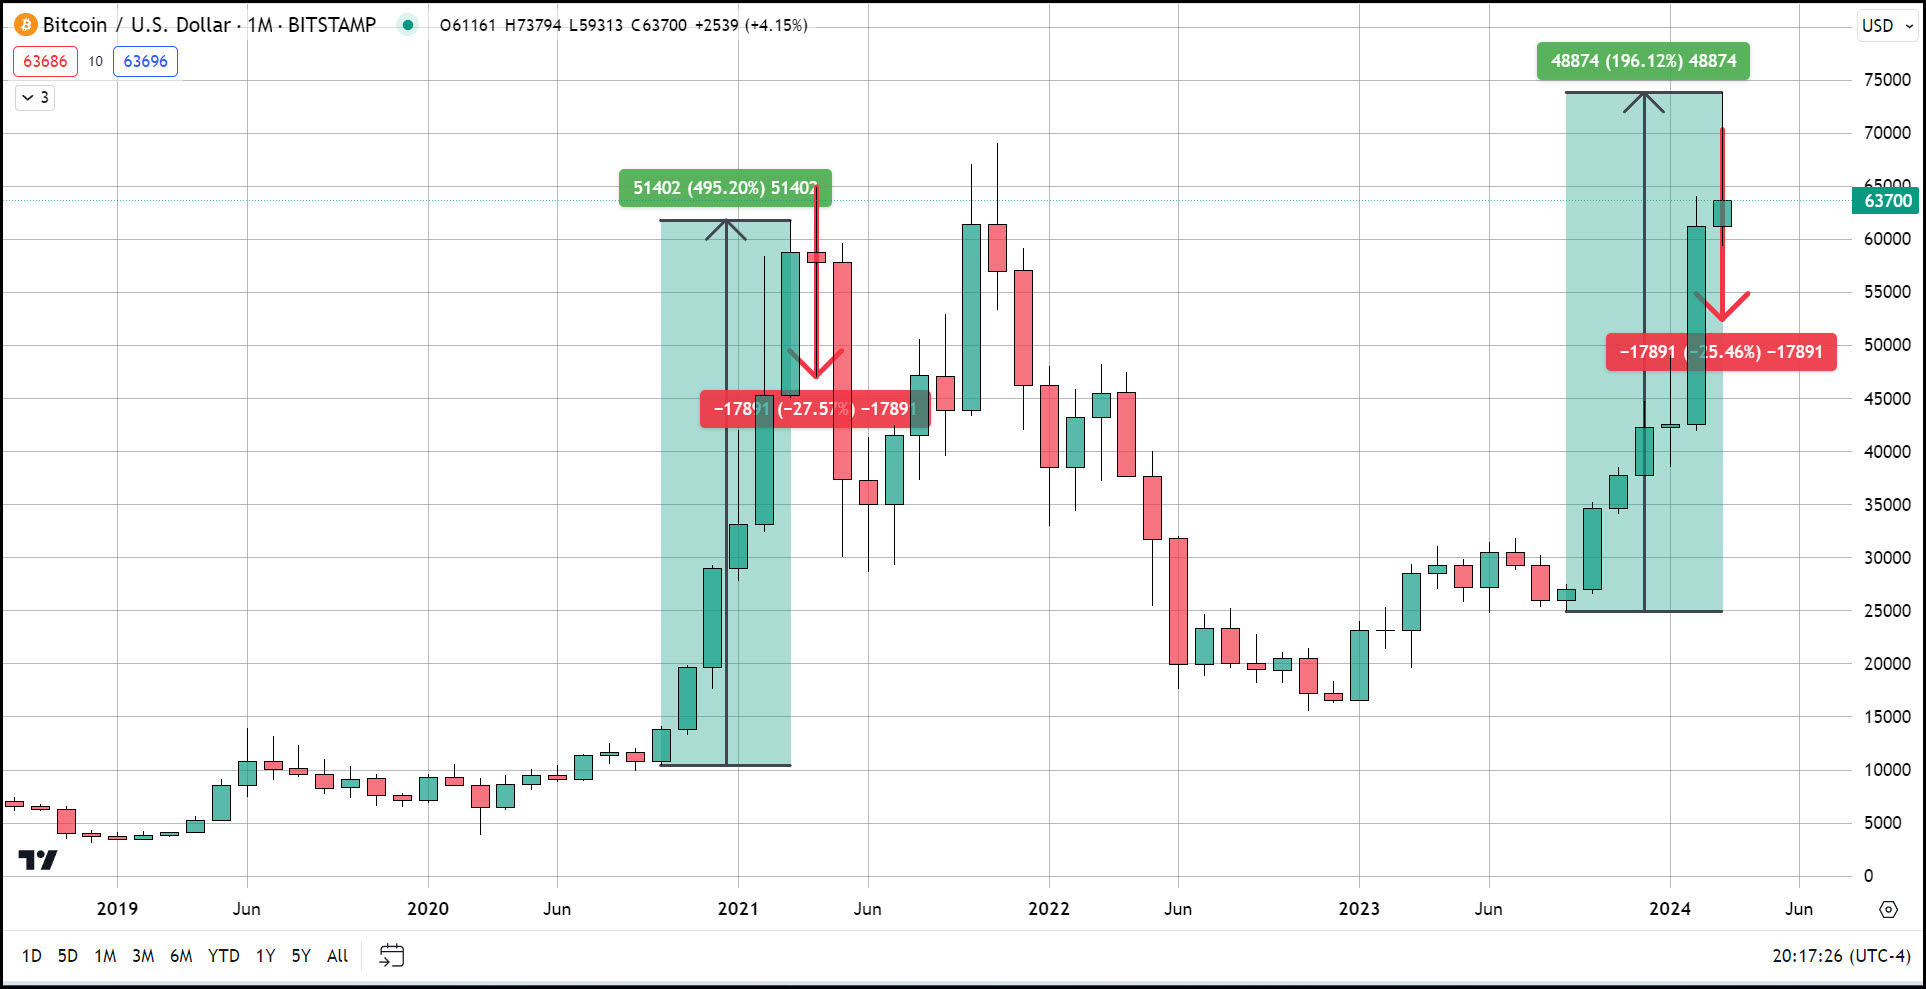
Another historical pattern that has played out in Bitcoin’s 15 years is that after experiencing six consecutive monthly gains, the following month has always been the start of a steep pullback or correction. The last six-month rise in price began in October 2020; six months later, Bitcoin had moved higher by $51,000. The highs and lows so far for the last six months are very close to 2020 equaling nearly $49,000 price difference from the lows to the highs.
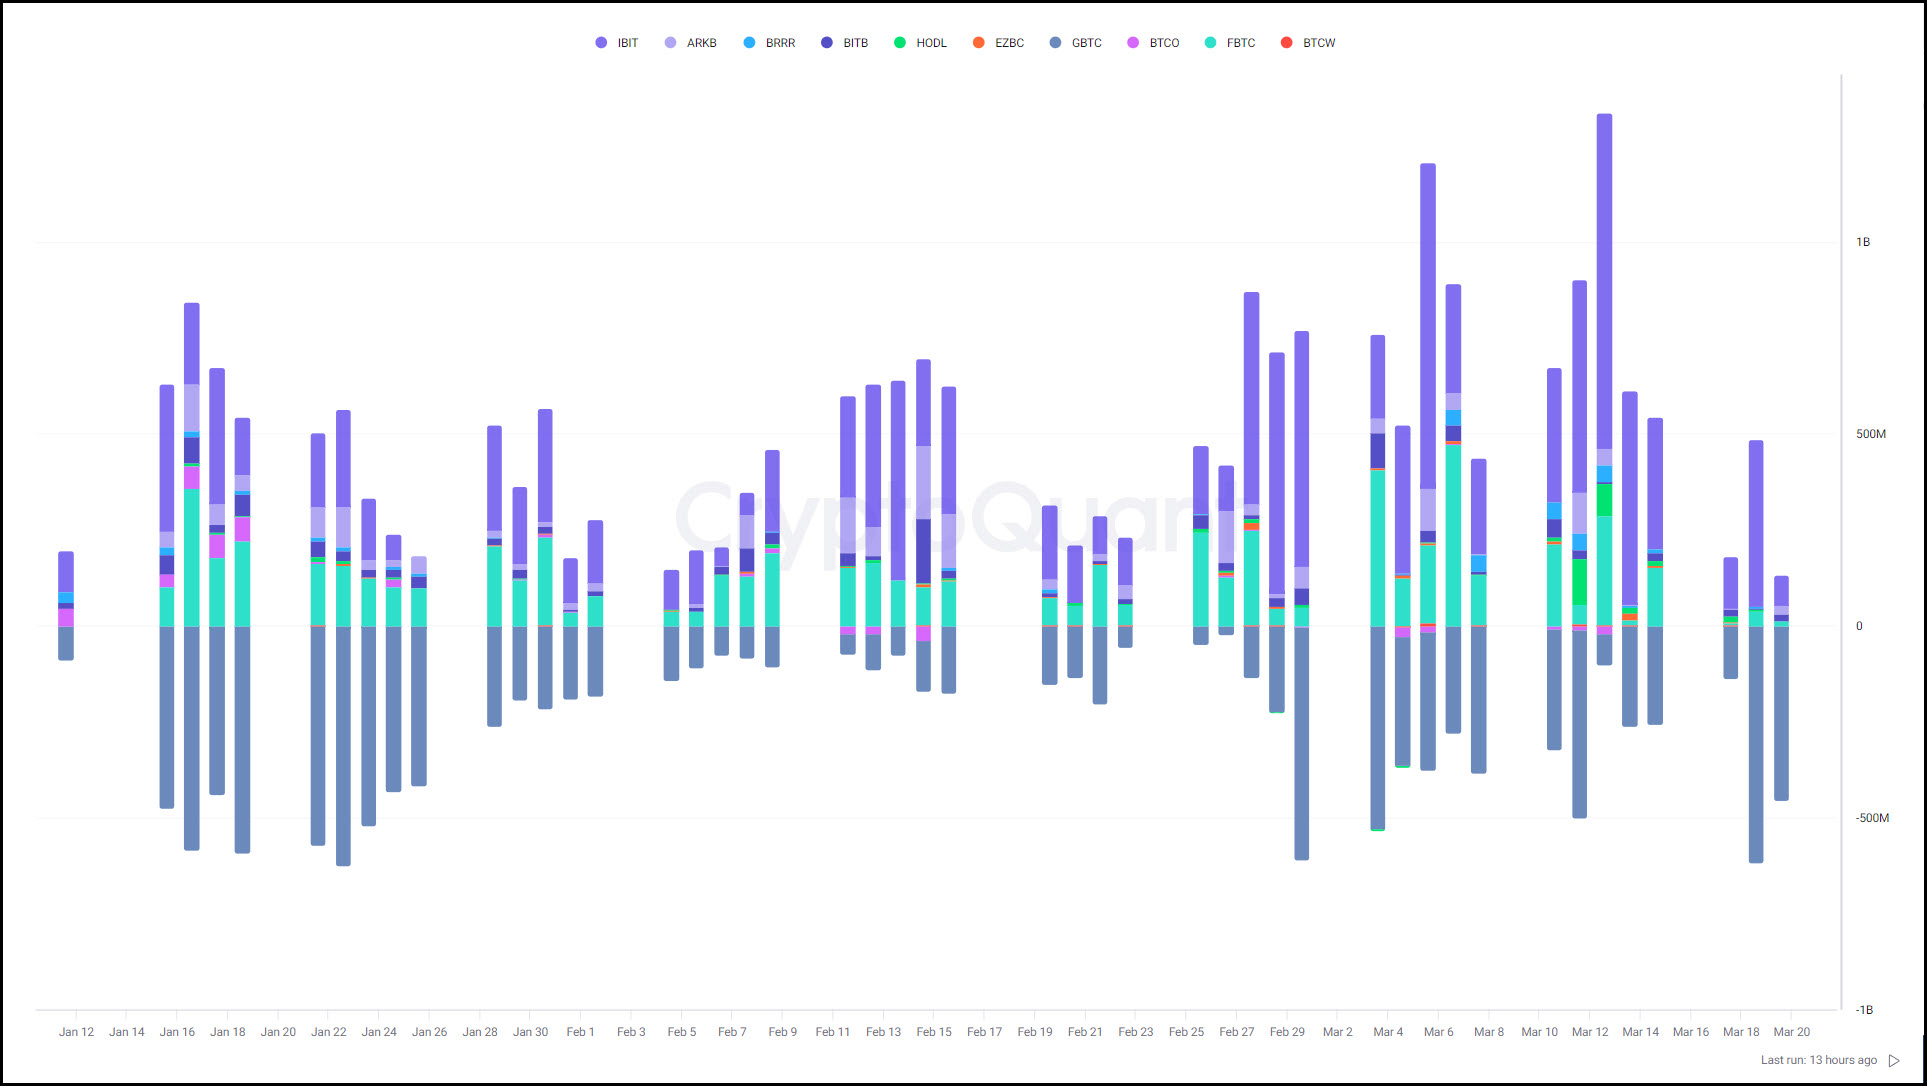
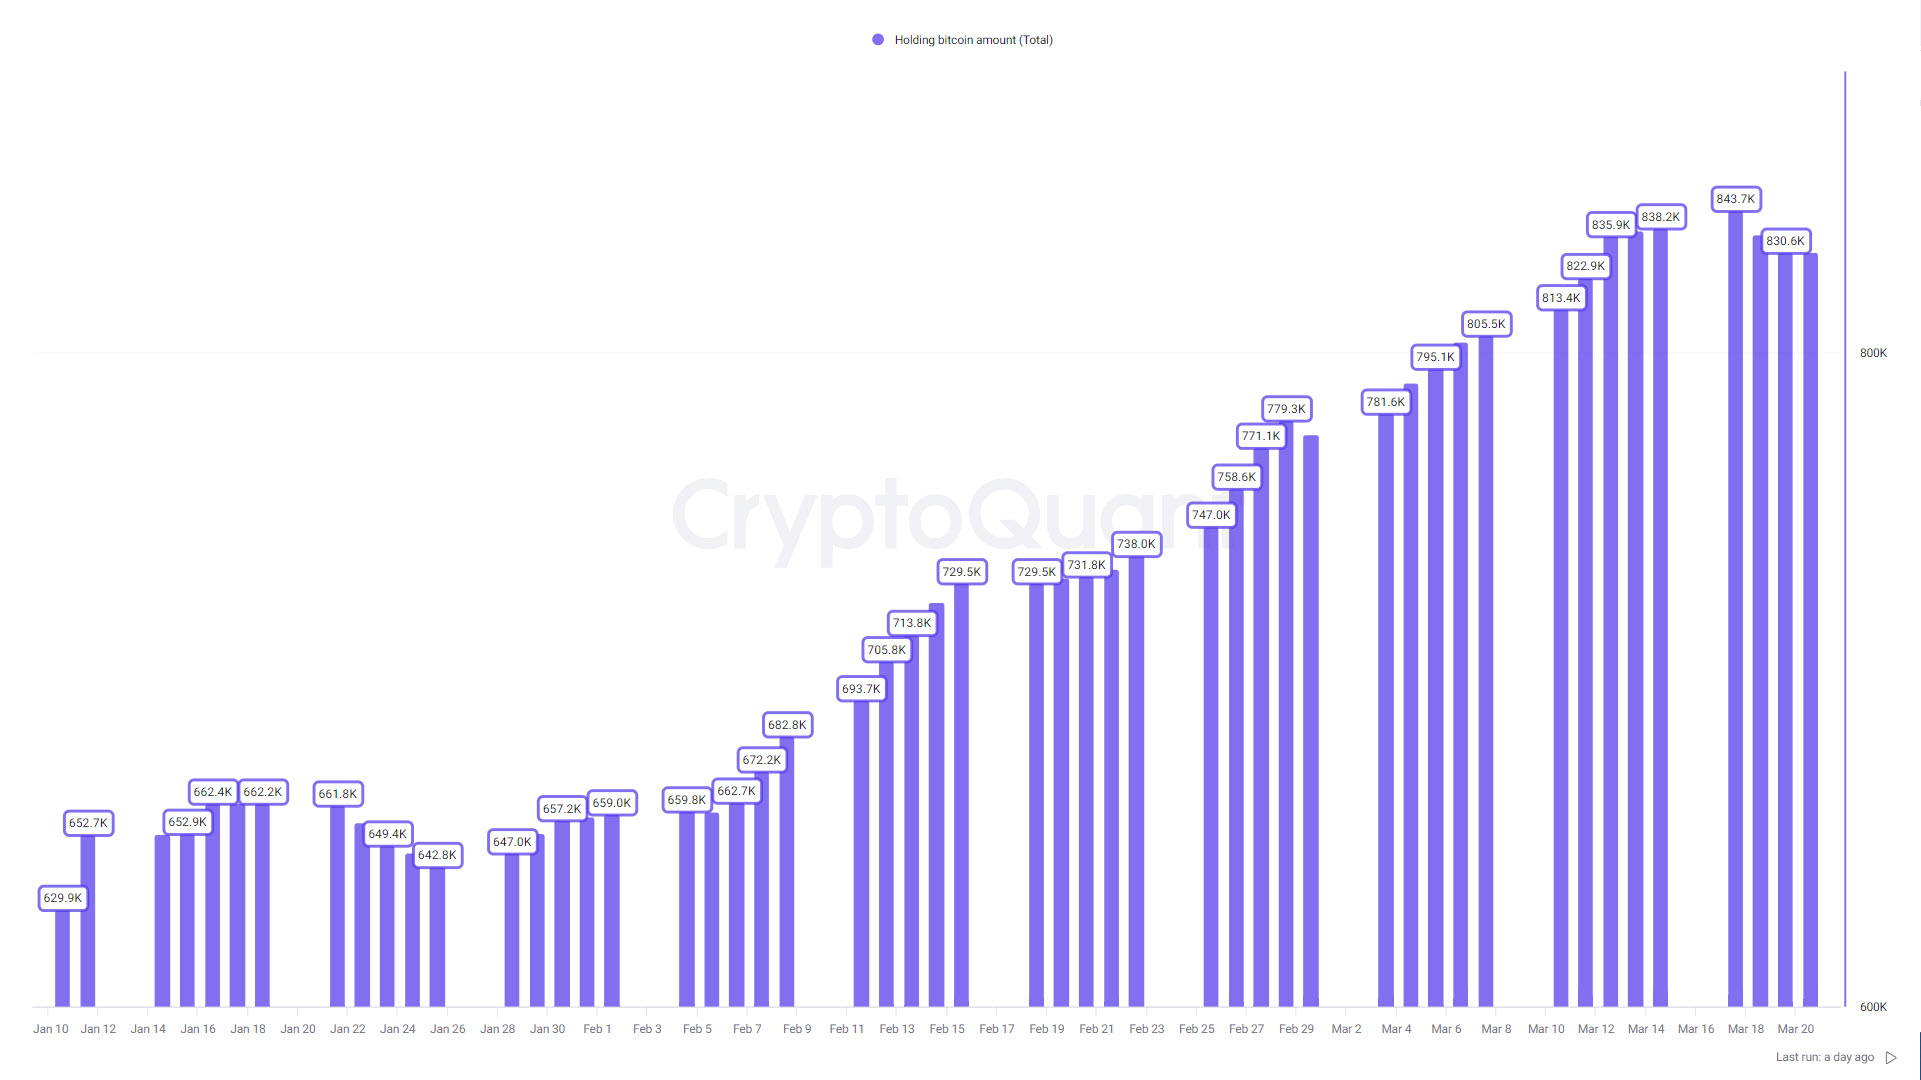
Fundamentals are also hinting at the crypto market entering a cool down period. ETF outflows have steadily increased since March 18th. ETF volume has grown to account for a larger percentage of total daily trading volume when compared to centralized exchanges. At the start of this month the ratio of ETF to CEX volume was around 8 to 1 in favor of traditional crypto exchanges currently the differential has shrunk to around 6.75 to 1, highlighting that the young electronically traded funds are quickly becoming a more utilized route for investors into Bitcoin. Even the CEX volume has been rapidly declining since the start of this week also.
Using technical, historical, and fundamental data in conjunction leads to the conclusion that Bitcoin is at a very high risk of falling to $50,000 in a best-case scenario and $30,000 in a worst-case scenario.