Different time frames for forecasting BTC

Bitcoin continues to form a base above the uber-important 61.8% Fibonacci retracement level residing at around $44,000. As of 3:30 PM EDT, Bitcoin is trading down 2% on the day at $45,600 (Coinbase). Although Bitcoin appears to be sandwiched between horizontal lines from support at the 61.8% retracement on the bottom and resistance at the 200-day moving average on top, the picture gives us different clues on different time frames.
Through the eyes of a weekly chart, our forecast of the accumulation period lasting two to three months before making a new all-time high seems to be playing out. We have noted on several occasions how the accumulation period would likely mirror the one seen last year from mid-May to August.
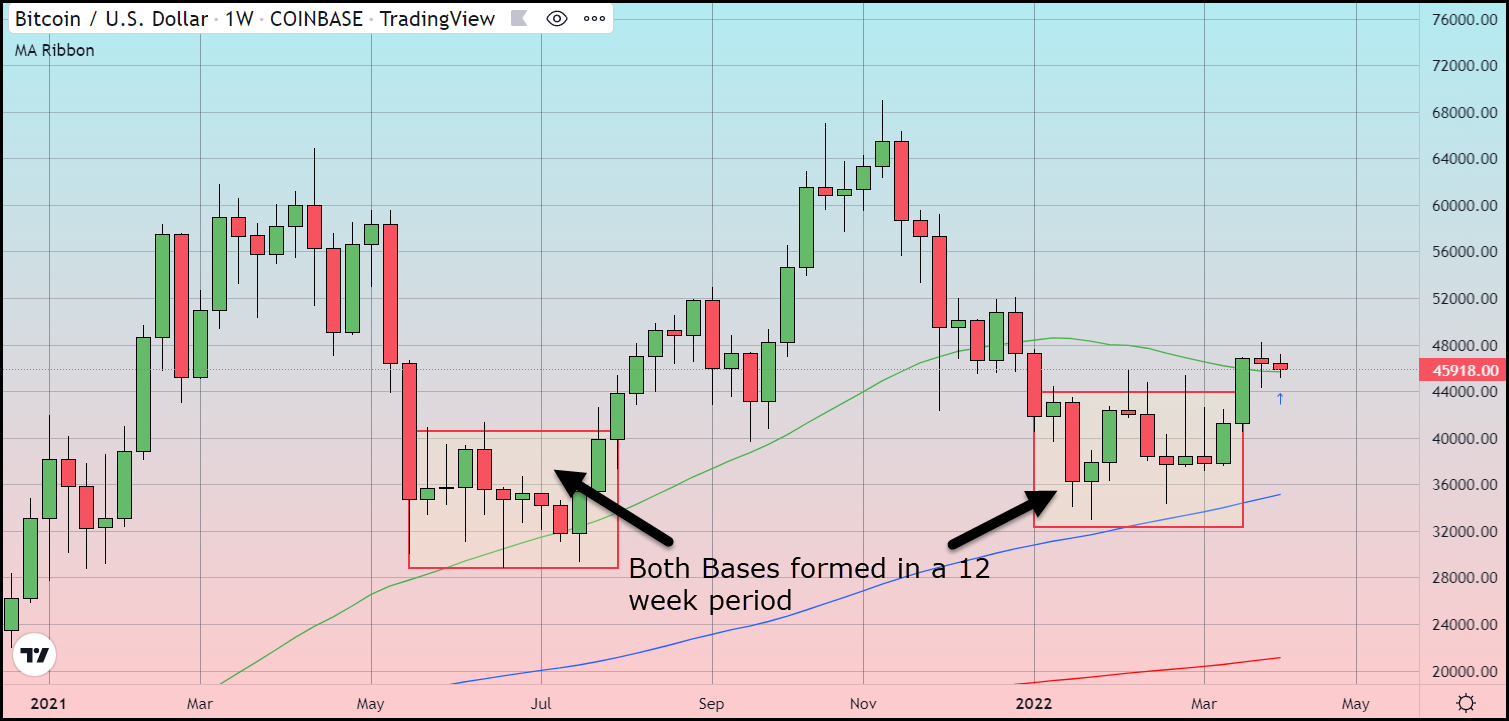
As shown above, the two periods of accumulation both last year and this year up until a few weeks ago both lasted the same amount of time, with both instances ending with a strong upside surge in the twelfth week after forming a base.
Viewing a 4-hour candlestick chart reveals that after hitting an apex at the highest price so far this year on March 28th of $48,245, Bitcoin entered into a compression triangle. This triangle pattern with a compressing of range in this instance is forecasting that Bitcoin will likely surge to the upside when the apex is hit (sometime in the next three days).
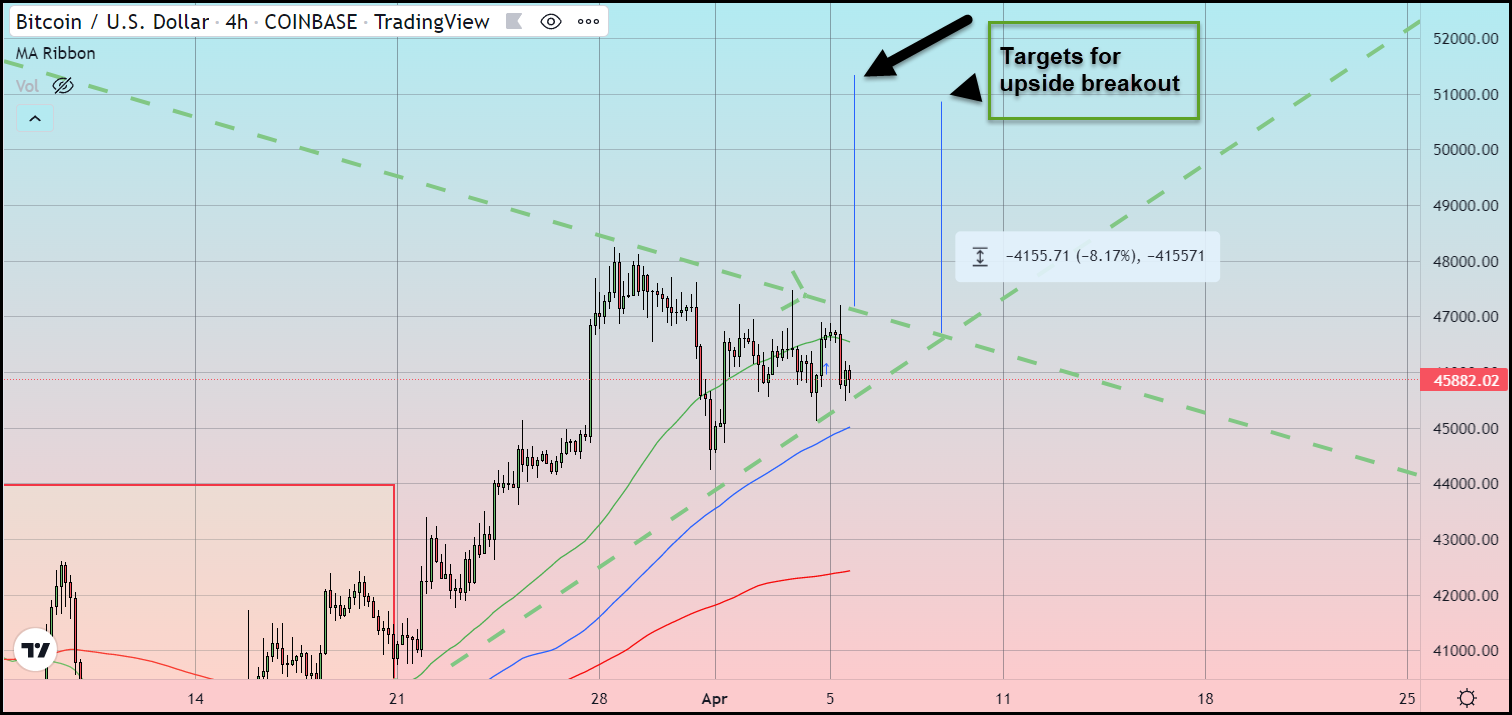
The compression triangle, also known as a wedge pattern, is when a market makes a series of higher lows and lower highs. To draw this pattern on any chart, you simply connect at least two of the highs and extend the line forward in time, then draw a similar trend line that connects at least two of the lows and extends. The point at which these two lines intersect is known as the apex. When a market breaks out of this pattern, it usually does so in the direction of the trend prior to entering the triangle, which in BTC is higher.
Bitcoin’s current triangle formation has a conclusion three days from now. It should be mentioned that rarely does a market stay inside the triangle all the way up to the apex before breaking out. So, three days is the maximum amount of time until we get a break either to higher or lower pricing, and it will likely happen in the next day or two.
Another way traders utilize a wedge for forecasting price is by marking the distance at the triangle’s widest depth and using that distance starting from after a breakout as a method for forecasting a price target once breached.
Using this method and assuming we breakout to the upside, we can forecast a target for this rally’s termination, and a good point in which to pull profits is right around $51,000.